Daily Chart: Longer-Term Bias: Neutral
4-Hour Chart: Short-Term Outlook: Bullish
Friday 17th July
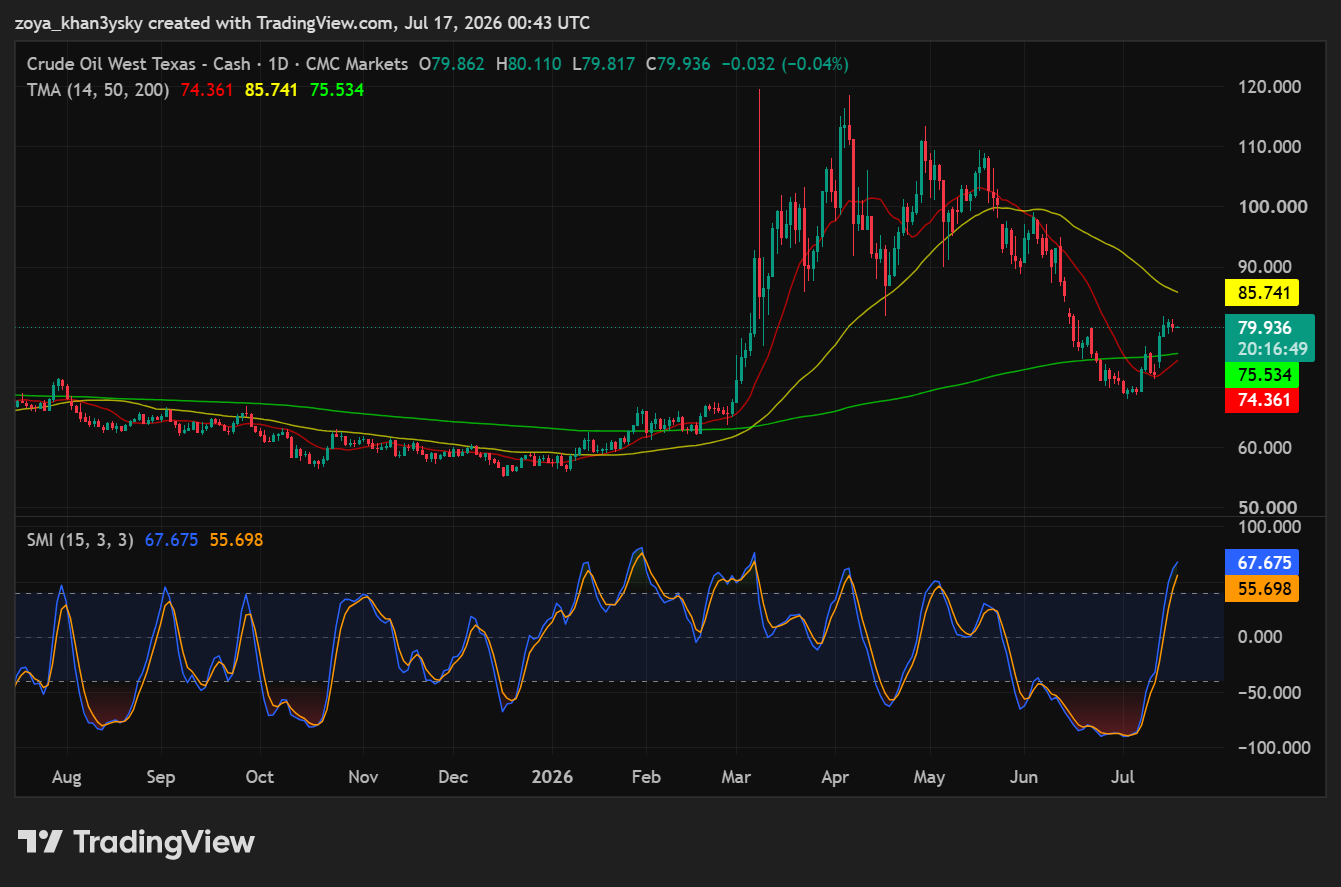
WTI crude’s daily chart is best described as neutral-transitioning-toward-constructive after a multi-month slide off the roughly 113 high made in the spring: price at 79.936 has just staged a sharp rally that’s pushed it back above the 200-day moving average at 75.534, a level that had capped every prior bounce attempt since the top and now flips from resistance to potential support if it holds. Price remains sandwiched between the 200-day (75.534) below and the 50-day at 85.741 above, with the 14-day average at 74.361 sitting just beneath current price after curling upward — the first sign that short-term momentum has actually turned rather than just bounced. What makes this more than a dead-cat bounce is the SMI: after spending June pinned near -80/-90 (deeply oversold) while price was making its lowest lows, the indicator has now spiked to 67.675/55.698, and importantly the June trough was noticeably deeper than the SMI reading on the initial decline in May even as price itself continued lower — a bullish momentum divergence that front-ran this rally and suggests the sellers’ grip was weakening well before price confirmed it. That said, one sharp rally off oversold doesn’t erase months of a downtrend, so the fair read is neutral-to-cautiously-bullish rather than an outright trend reversal: a close above the 50-day at 85.741 would be the first real confirmation of a larger base, opening a path toward the 100.00 psychological level and prior consolidation zone from earlier in the year. Traders looking to participate in the bounce should favor waiting for a pullback toward the 200-day at 75.534 to establish long exposure with a stop below 74.361 (the 14-day average and recent swing low), while a failure to hold 74.361 would put the 65.00 area — the base built last summer — back in play on the downside.
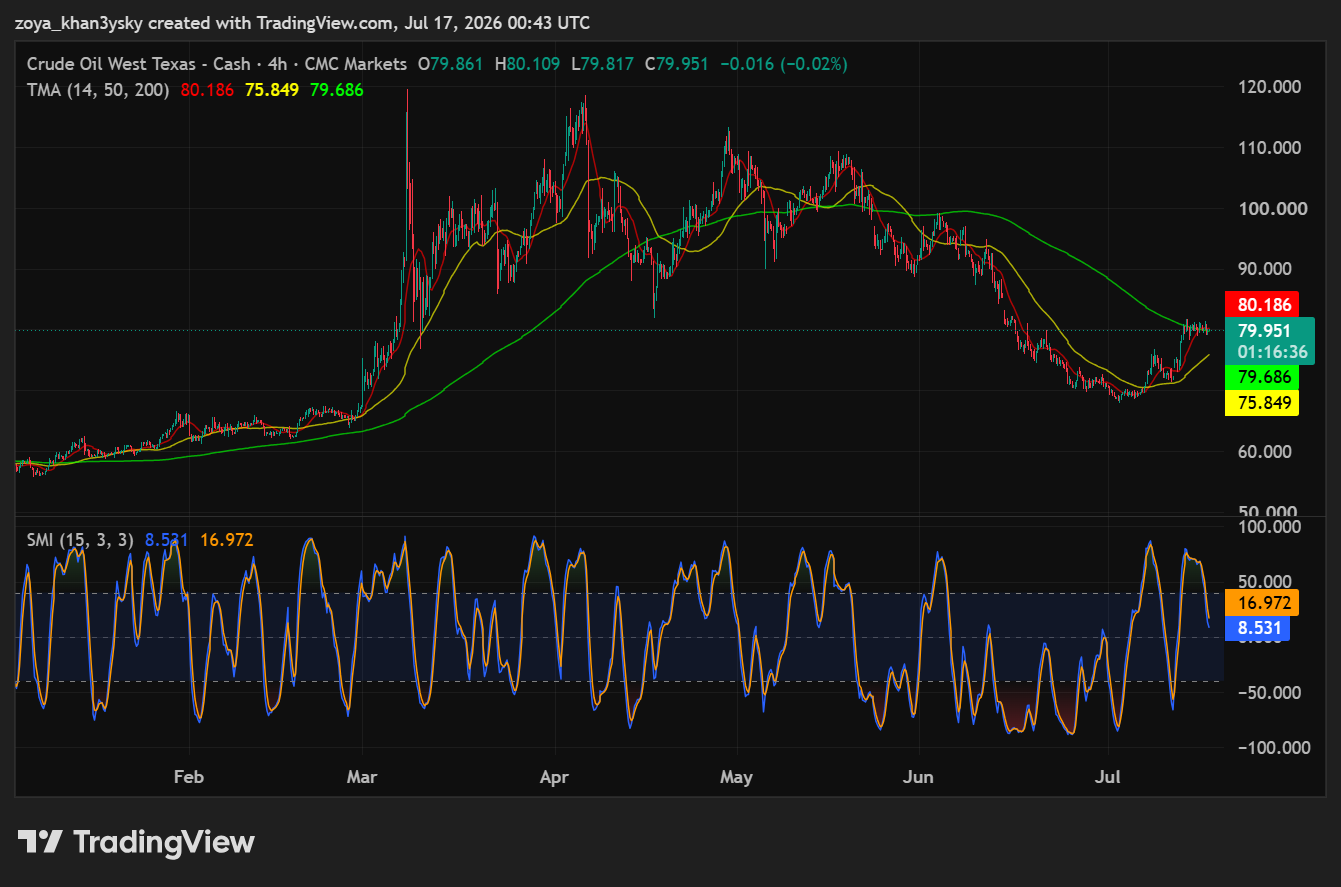
The 4-hour chart shows short-term momentum has clearly turned in favor of the bulls: price at 79.951 has pushed back above both the 200-period moving average (green) at 79.686 and is now testing the 14-period average at 80.186 from below, while the 50-period average at 75.849 lags well beneath price — a bullish stacking sequence (price and fast average above the slow averages) that confirms buyers have taken control of the intraday trend after the multi-week grind lower into late June. The SMI reinforces this: it plunged to roughly -80 in early June and again in late June/early July, but the second trough was shallower than the first even though price made a marginally lower low on that second dip, a textbook bullish divergence that preceded the current sharp thrust to 67-plus on the indicator, now firmly in overbought territory. Being overbought on a fast timeframe after such a sharp move does raise the odds of a consolidation or shallow pullback before the next leg, but as long as price holds above the 200-period average at 79.686 the structure remains bullish and dips should be viewed as opportunities rather than reversal signals. A break and hold above the 14-period average at 80.186 would open the door toward the 85.00 supply zone (the ceiling from April’s failed rally attempt), while a stop placed just below the 79.686/79.686 confluence of the 200-period average and recent support protects against a failed breakout, with a break of that level shifting the short-term bias back to neutral and exposing the 75.849 area (50-period average) as the next downside test.
Daily Chart: Longer-Term Bias: Neutral
4-Hour Chart: Short-Term Outlook: Bullish
Thursday 16th July
The daily chart shows crude in a transitional, base-building phase after a steep multi-month decline from the highs above $110 down to the mid-$60s. Price closed at 80.54, now trading above both the 200-day moving average (75.45, green) and the 14-day (73.80, red), but still capped by the 50-day (86.07, yellow), which sits well above current price — a legacy of the sharp sell-off that dragged the shorter average down faster than the longer one, leaving the moving averages in a mixed, non-trending alignment rather than a clean bullish or bearish stack. That matters because reclaiming the 200-day is typically the first technical signal that a downtrend is stalling, but the market hasn’t yet cleared the 50-day, which is the level that would need to break for this to graduate from “oversold bounce” to genuine trend reversal. The Stochastic Momentum Index has surged from deeply oversold levels (below -50 in June) up to 63.83/44.81, a sharp positive swing that shows momentum recovering faster than price — a bullish divergence relative to the muted price action of the prior two months, and consistent with a durable low being put in rather than a one-off spike. Given the mixed moving-average picture, a neutral-with-upside-bias stance is appropriate: a sustained close above the 50-day MA (86.07) would open room toward the 90.00 shelf where price previously consolidated before the breakdown, while a failure to hold the 200-day (75.45) would suggest the bounce is fading and put the 14-day (73.80) and then the recent lows back in focus. Traders leaning long on this reversal should anchor stops below the 200-day MA, around 74.00–74.50, to protect against the rally proving to be a temporary short-covering move within a still-larger downtrend.
The 4-hour chart tells a clearer bullish story than the daily: price has just pushed back above its 200-period moving average (80.02, green), a level that had capped every rally attempt during the multi-month downtrend and is now being tested as support for the first time since the decline began — a classic trend-change signal when it holds. Price is also trading above the 50-period (74.58, yellow) and 14-period (80.11, red) averages, and while the shorter-term averages are still catching up after the sharp reversal, the sequencing (price > 200 > 50, with the 14-period converging quickly) reflects fast-building short-term strength. The Stochastic Momentum Index is running hot at 68.26/67.92, solidly in overbought territory, which flags that this leg of the rally is extended and a near-term pause or shallow pullback toward the moving-average cluster wouldn’t be unusual — but overbought readings during the early stage of a trend reversal often persist rather than immediately reverse, so this is a caution flag rather than a sell signal on its own. The near-term setup favors buying dips: immediate resistance sits at the recent swing high of 81.08, with a break there opening a path toward the 86.00 zone that aligns with the daily 50-day MA; support is the 200-period MA at 80.02, and a clean loss of that level would undercut the bullish reversal thesis and shift focus back to the 74.58 area. A tactical long here would look to place a stop below 78.50–79.00 (under the 200-period MA with a buffer for volatility), giving the trade room while still protecting against a failed breakout.
Wednesday 15th July
The daily chart shows crude basing out after a sharp multi-month decline off the 2026 spike high above 110. Price recently bottomed in the low-70s, dipped just under the 200-day MA (75.35), and has now staged a strong reversal candle back above it, closing at 80.61. That reclaim of the 200-day is meaningful — it’s the line dividing the broader downtrend from a potential trend change, and holding above it would be the first real evidence that the multi-month slide has stalled. The 14-day MA (73.14) and 50-day MA (86.44) are still stacked in bearish order above and below current price, respectively, so the moving-average picture is mixed rather than confirming a clean uptrend yet; a sustained close back above 86.44 would be needed to flip the longer-term structure bullish. The Stochastic Momentum Index has just surged from deep oversold (below -50, where it spent most of June) to 48.9, a sharp move that shows genuine bullish momentum returning rather than a divergence — price and momentum are moving in the same direction, which supports the reversal rather than warning against it. That said, a move this fast off the lows often cools off before continuing, so chasing strength here carries some risk. An upside target near 86.44 (the 50-day MA) is the first logical objective, with a bigger test at the 100 handle if the recovery extends. A stop below the recent swing low around 75.35 (the 200-day MA) would protect against this turning out to be a bear-market bounce rather than a genuine reversal.
The 4-hour chart shows an even sharper version of the same story: price has ripped through both the 14-period MA (77.69) and the 50-period MA (73.31) in a single strong impulse, and has now cleared the 200-period MA (80.34) as well — a full moving-average reclaim in one move, which is a strong short-term bullish signal since all three averages are now acting as support beneath price rather than resistance above it. The Stochastic Momentum Index has spiked to roughly 71, deep into overbought territory, after cycling repeatedly between extremes over the past few months in this choppy range. Unlike the daily chart, this reading is a genuine caution flag on the 4-hour timeframe: momentum this stretched on a shorter timeframe often precedes at least a pause or partial pullback even within an intact uptrend, so there isn’t a clean divergence here, just a momentum extreme that argues against adding to length right at current levels. Immediate resistance sits in the 86–90 zone where price previously consolidated for weeks before breaking down; a pullback that holds above the 200-period MA (80.34) would keep the short-term structure constructive. Support on a retracement is first at the 14-period MA (77.69), with the 50-period MA (73.31) as a deeper line in the sand. A stop below 80.34 (the 200-period MA) is the tighter, more conservative placement for a long entered on this breakout, given how extended the SMI reading is right now.
Tuesday 14th July
WTI crude’s daily chart is showing a forceful reversal off the lows, with price (79.803, +1.65% on the session) breaking back above both the 200-period moving average (green, 75.254) and the 14-period moving average (red, 72.554) after a months-long decline from the spike above 115 earlier this year. Reclaiming the 200-period MA is meaningful because it’s widely treated as the dividing line between a longer-term uptrend and downtrend, and today’s strong green candle pushing through it suggests buyers are stepping in with genuine conviction rather than just a brief bounce. The one moving average still overhead is the 50-period (yellow, 86.769), which now becomes the key test — a sustained close above it would confirm this has become a durable trend change rather than just a rebound within the broader downtrend. The Stochastic Momentum Index reinforces this: it plunged deep into oversold territory through June, and the sharp jump to 26.908/2.140 — essentially a full swing from oversold back toward neutral/positive in a short span — mirrors the magnitude of the price reversal rather than lagging behind it, which supports the idea that this move has real underlying momentum instead of being a weak, fading bounce. For traders leaning into the reversal, 86.769 (the 50-period MA) is the first real resistance test, with a further target near 95.00 if that breaks; a stop placed below the 200-period MA at 75.254 would define risk against the reversal failing and price slipping back into the prior downtrend.
On the 4-hour chart, price (79.818) is trading right around the 200-period moving average (80.717), having already reclaimed the 14-period (74.338) and 50-period (71.941) MAs to the downside — meaning the shorter-term averages have flipped bullish while the longest-term average is the immediate line in the sand. A confirmed close above 80.717 would put price back above the full MA stack, a fully bullish alignment that would confirm the short-term trend has turned alongside the daily reversal; failure to hold above it would suggest this is just an intraday spike testing resistance rather than a clean breakout. The Stochastic Momentum Index is deep in overbought territory at 71.322/55.840, its highest reading in months, which signals the current thrust is stretched and increases the likelihood of a short-term pause or pullback even if the broader reversal continues — momentum is confirming the strength of the move while simultaneously warning it’s due for a breather, not showing a bearish divergence. Immediate resistance sits near the 85.00 swing high from May, aligning with the daily chart’s climb toward the 86.769 level. Support is layered at the 200-period MA (80.717) and then the 14-period MA (74.338) further down. Traders looking to participate in the short-term reversal might wait for a pullback toward the 78–80 zone rather than chasing the current overbought spike, with a stop below the 14-period MA (74.338) to manage risk if the move stalls out and reverses back into the prior downtrend.
Monday 13th July
The daily chart shows crude in the process of testing a major inflection point after a volatile round trip — price spiked from a long base near 60-65 to nearly 118 earlier this year before collapsing back down through both the 50-day and 200-day averages. Price is now pressing right up against the 200-day moving average (green, 75.139) from below, with today’s close of 74.38 sitting just under that line; a decisive close above it would be the first real signal that the multi-month downtrend has stalled, while the 50-day average (yellow, 87.176) remains far overhead and largely irrelevant to near-term price action given how steeply it’s still declining. More encouraging is the momentum picture: the Stochastic Momentum Index printed a deep oversold extreme below -80 back in June, and price has since carved a higher low while the SMI is now curling up through -16/-29 — a bullish momentum divergence that suggests selling pressure is fading even though price itself hasn’t yet broken its longer-term structure. This keeps the daily bias neutral rather than outright bullish: a clean break and hold above the 200-day MA at 75.139 would open the door toward the 87.176 zone, whereas failure here and a rollover back below the rising 14-day MA (71.647) would point back toward the 65.00 support shelf that held for months before the earlier breakout.
On the 4-hour timeframe, the setup is more constructively bullish in the near term. Price has moved back above both the 14-period (73.187) and 50-period (71.207) moving averages, a short-term bullish crossover that reflects the sharp +3% rally seen today, though the 200-period average (green, 81.282) still looms well overhead and keeps the broader intraday trend technically bearish until price closes that gap. The Stochastic Momentum Index has snapped hard off an oversold extreme near -80 to current levels around -48/-52, which is a meaningful momentum shift but still below the zero line — meaning this looks like a relief bounce gaining traction rather than a fully confirmed reversal. Immediate resistance sits near the recent swing high around 76.00, with the 200-period MA at 81.282 as the next real technical hurdle above that; on the downside, the 50-period MA at 71.207 is the first support to hold onto this bounce, and a break below it would put the 68.00 swing low back in play.
Friday 10th July
WTI’s daily structure remains bearish after the parabolic spike toward ~118 collapsed into a sustained downtrend: price has fallen through both the 50-day MA (yellow, 87.834) and the 200-day MA (green, 75.079), and both are still stacked above the current close of 72.447, meaning the broader trend structure continues to favor sellers on any rally into those averages. That said, the decline has clearly lost velocity — the 14-day MA (red, 71.681) has flattened and price is now trading just above it after weeks of chopping in the 68–75 range rather than making fresh accelerating lows, a first sign that the aggressive down-move is maturing into a base. The momentum picture reinforces this: the Stochastic Momentum Index carved a deep low near -80 in June, and on the subsequent retest of similar price lows it printed a shallower trough before turning up to -30.96/-41.15 — a bullish divergence where price held its lows while momentum improved, often an early tell that selling pressure is fading even if the trend hasn’t reversed yet. Given the SMI is still in negative territory and both major MAs remain overhead, the near-term bias stays bearish-to-neutral rather than an outright reversal call; a daily close back above the 200-day MA at 75.08 would be the first real evidence of a trend change, with 80.00 and then the 50-day MA at 87.83 as the next hurdles above that. Conversely, a breakdown below the 68–70 support shelf would negate the basing pattern and expose 60.00 as the next magnet. Traders leaning on the divergence for a tactical long should keep a stop below 68.00 (below the June lows that define the current base), since a break there invalidates the bullish-momentum thesis entirely.
The 4-hour chart shows the first tangible short-term bullish signal in this recent leg: price has pushed back above the 50-period MA (yellow, 71.091) after months trapped beneath the 200-period MA (green, 81.928), and the recent bounce is now testing the 14-period MA (red, 73.742) from below — a reclaim of that level would confirm short-term strength is building rather than just a technical bounce. The 200-period MA remains the dominant overhead barrier, sitting well above spot and marking the level that separates a corrective bounce from a genuine trend reversal on this timeframe. Momentum is the more compelling part of the setup: the Stochastic Momentum Index has just crossed from deeply negative territory up through the zero line to 0.924/-11.654, and this move follows a pattern of progressively higher SMI lows on each recent retest of the 68–70 price zone — a clear bullish divergence between flattening price action and improving momentum that supports the idea of near-term upside continuation. A break above the 73.74 level opens room toward 75.00 and eventually the 200-period MA near 81.93, while losing the 50-period MA at 71.09 would suggest the bounce is fading and put the 68.00 swing low back in play. Given the momentum isn’t yet overbought, there’s room for this move to run further before it becomes stretched, and a stop placed below 71.00 (just under the 50-period MA) keeps risk defined against the level currently underpinning the short-term bullish case.