EUR/USD
 21 Jul 2026
EUR/USD: 4-hourly and daily chart technical view
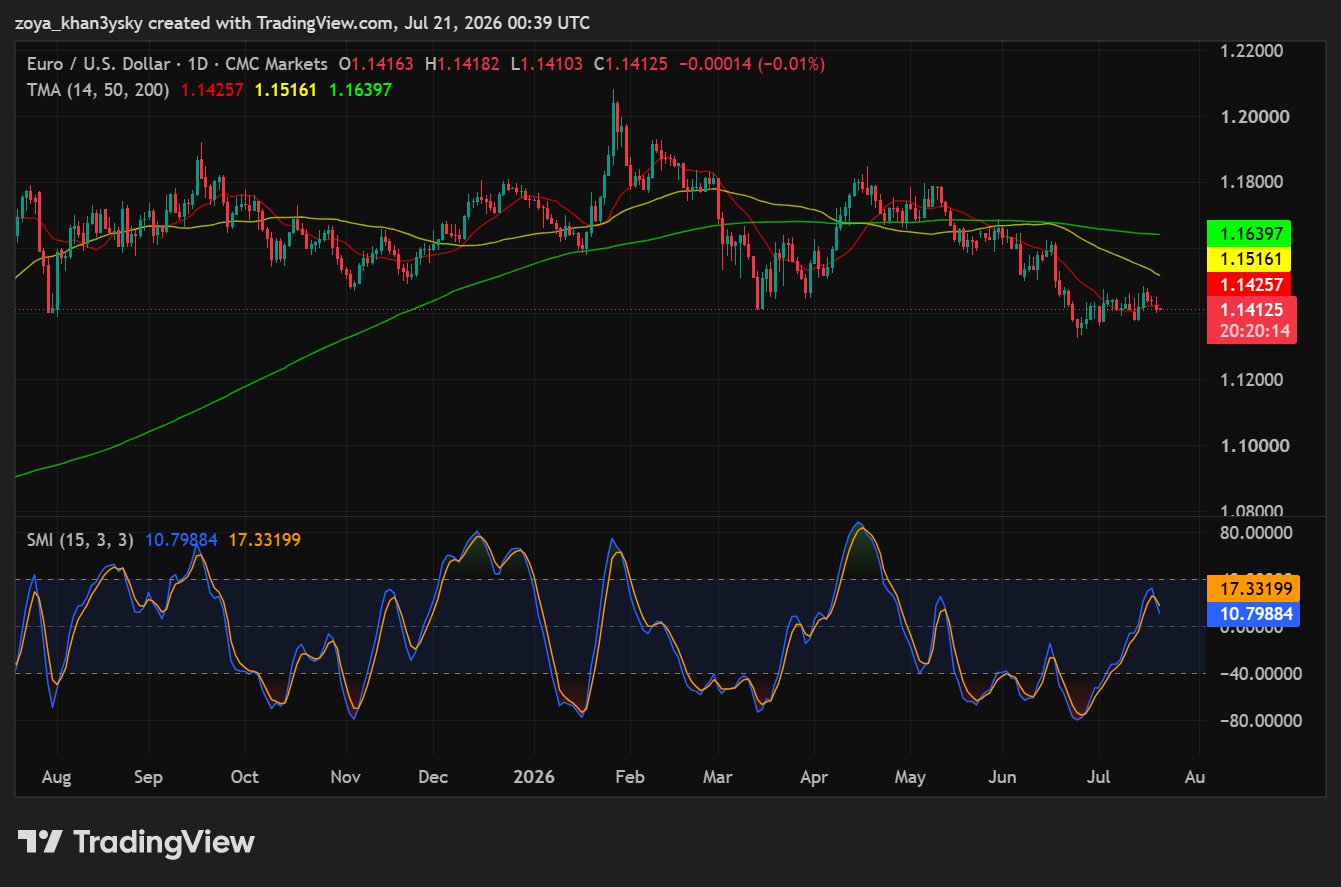
Daily Chart: Longer Term Bias: Bearish
| Resistance |
1.14257 then 1.15161 |
| Support |
1.14125 then 1.12000 |
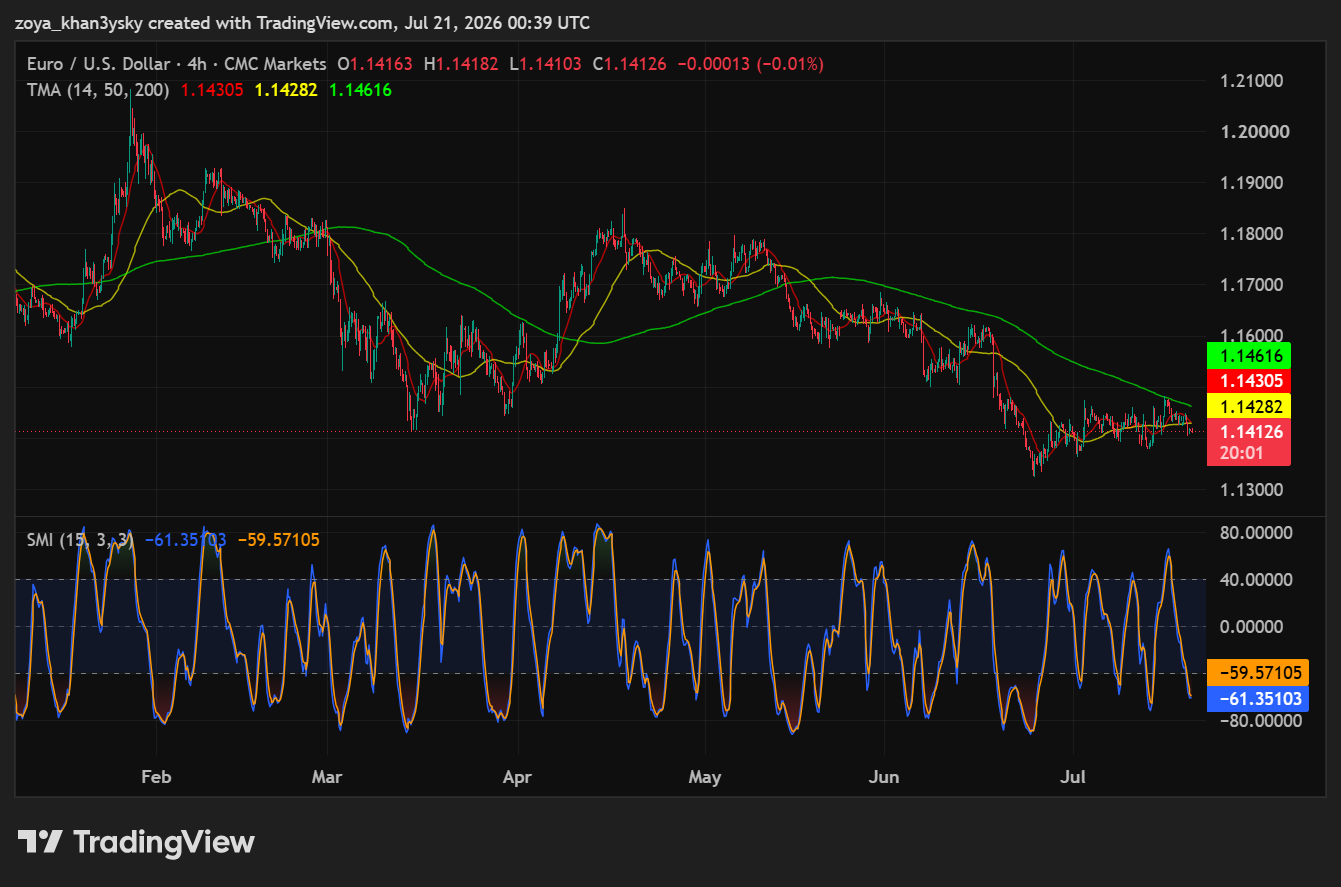
4-Hour Chart: Short-Term Outlook: Bearish
| Resistance |
1.14282 then 1.14616 |
| Support |
1.13800 then 1.13000 |
Daily Chart: Longer-Term Bias: Bearish
4-Hour Chart: Short-Term Outlook: Bearish
Tuesday 21st July
The daily chart shows EUR/USD in a sustained downtrend that has carried price from a February peak above 1.19 down to the current 1.14125, with the pair now trading below all three moving averages — the 14-day (1.14257), 50-day (1.15161), and 200-day (1.16397) — in a fully bearish descending stack that confirms sellers have controlled the tape for several months. The 200-day average in particular has been sloping lower since April, a shift from its earlier uptrend, which reflects the broader change in trend character over the year and reinforces that this is a structural decline rather than a short-term dip. The Stochastic Momentum Index sits at 10.80/17.33, having just curled up out of negative territory after a stretch of weak, sub-zero readings, but it has not reached oversold extremes the way it did during the sharper legs down in September and May — this modest uptick without a corresponding higher low in price is a mild sign that selling pressure may be pausing rather than reversing, so it’s better read as a potential short-term bounce risk than a genuine trend-change signal. Immediate resistance sits at the 14-day MA near 1.14257, with a tougher ceiling at the 50-day MA around 1.15161; a close back above the 50-day would be needed to meaningfully challenge the bearish structure. On the downside, a break below the recent range lows near 1.14000 would expose the psychologically significant 1.12000 level. Given the moving-average alignment and lack of confirmed bullish divergence, the bias remains bearish, with a stop loss placed above 1.14700 (above the 50-day MA) recommended for traders positioning for continuation of the downtrend.
The 4-hour chart mirrors the daily picture, with price at 1.14126 trading below the 14-period (1.14305), 50-period (1.14282), and 200-period (1.14616) moving averages, all three of which have been sloping down steadily since the decline accelerated in June, confirming a well-established near-term downtrend with no sign yet of the averages flattening or turning. Price has spent the past several weeks consolidating in a tight band just under these averages, repeatedly failing to reclaim the 50-period line, which underscores how firmly that level is now acting as overhead resistance. The Stochastic Momentum Index reads -61.35/-59.57, deep in oversold territory, and notably it has been carving out a series of slightly higher lows over the past few weeks even as price has made marginal new lows — a textbook bullish momentum divergence that suggests selling pressure is losing steam on this timeframe, even though the broader trend remains down. This divergence doesn’t yet override the bearish trend structure, but it does argue for caution chasing shorts at current levels and raises the odds of a near-term relief bounce toward resistance before any further decline. Immediate resistance is at the 50-period MA near 1.14282, with a tougher ceiling at the 200-period MA around 1.14616 — a break above the latter would be the first real signal of short-term trend change. Support lies at the recent consolidation low near 1.13800, with 1.13000 as a further downside target if the range breaks; a stop loss just above 1.14650 would protect against a divergence-driven bounce invalidating a short position.
Daily Chart: Longer-Term Bias: Bearish
4-Hour Chart: Short-Term Outlook: Bearish
Monday 20th July
The EUR/USD daily chart shows a currency pair in a well-established downtrend, with price at 1.14313 trading below both the 50-day moving average at 1.15230 and the 200-day moving average at 1.16407 — a bearish stack that has been in place since the sharp reversal off the February spike high near 1.2000, and one that has seen the index shed roughly 800 pips over the following months as it broke down through a series of former support shelves. The 200-day MA in particular has now flattened and begun sloping lower after months of gently rising, a shift that reflects how the earlier uptrend has been fully overwritten by the recent downside momentum, while the 50-day MA sitting well above current price continues to act as the more immediate technical ceiling that any recovery attempt would need to clear first. The Stochastic Momentum Index tells a more nuanced story here: after diving to a deeply oversold reading near -70 during the most recent leg lower, it has since rebounded sharply to 28.93/27.13, and because this bounce in momentum is occurring alongside price stabilizing near its recent lows rather than making a fresh low, it reflects a tentative bullish divergence — momentum improving faster than price — that could support a near-term corrective bounce, even though it doesn’t yet override the dominant bearish trend structure. Immediate support sits at the round-number 1.1400 level, with the recent swing low near 1.1324 as the more significant downside reference; a clean break below that would open the door toward a retest of the low-1.12s. Given the bearish MA alignment but improving short-term momentum, the more prudent approach is to treat any bounce toward the 1.1523 resistance as a selling opportunity within the broader downtrend, with a stop placed above 1.1650 (above the 200-day MA) to guard against a more durable trend reversal.
The 4-hour chart shows price at 1.14313 caught in a tight, choppy zone just beneath the 14-period MA at 1.14443 and the 200-period MA at 1.14674, while sitting marginally above the 50-period MA at 1.14270 — a compressed moving-average cluster that reflects the pause following the aggressive multi-week decline from the April highs near 1.1800 down to current levels. This kind of tight bunching after a strong directional move often signals consolidation before the next leg, and with the 200-period MA still sloping down from well above current price, the path of least resistance technically remains lower unless buyers can force a clean reclaim of that average. The Stochastic Momentum Index is at -43.64/-31.80, and the oscillator’s behavior on this timeframe has been characteristically choppy, swinging repeatedly between roughly +60 and -70 over the past several months without establishing any clear divergence against price — each momentum peak has simply mirrored a corresponding price peak within the broader downtrend, offering no early warning of a reversal at this stage. Immediate resistance is the 1.1444–1.1467 zone tied to the 14- and 200-period MAs, and a move back above that cluster would be needed to shift the short-term bias constructive; support lies at the 1.1400 round number, with 1.1350 as the next downside level tied to the recent consolidation low. Given the still-bearish moving-average positioning and lack of momentum divergence, traders should favor selling rallies into the 1.1444–1.1467 resistance zone, with a stop above 1.1470 to manage risk if the pair breaks out of its current range to the upside.
Friday 17th July
EUR/USD’s daily chart remains in a longer-term downtrend that’s been in force since the failed rally toward 1.19 back in the winter: price at 1.14458 sits below both the 50-day moving average at 1.15302 and the 200-day at 1.16414, a bearish stack that confirms sellers have controlled the broader trend, though it has just edged back above the 14-day average at 1.14241, a first tentative sign that short-term selling pressure is easing after the sharp slide through June and early July. The 50-day average is the more important hurdle here — repeated failures to reclaim it since April have kept the pair capped, and it would need to be broken and held above to argue for anything beyond a corrective bounce. The Stochastic Momentum Index offers a genuinely constructive signal, however: the low it printed in early July was noticeably shallower than the low from the June sell-off even though price itself pushed to a marginal new low over that stretch, a classic bullish momentum divergence, and the SMI has now turned up sharply to 34.16/26.44, climbing out of oversold territory. That divergence is enough to soften the bearish conviction to “bearish-with-a-bounce-in-progress” rather than an outright continuation signal, so the practical read is to expect near-term strength toward the 1.15302 resistance (the 50-day average) before reassessing, with a break above that level opening the way to 1.16414 (the 200-day average and broader trend line). A stop for any long taken on this bounce should sit below 1.14241, since a failure there would resume the downtrend and expose 1.13500, the psychological round-number support last tested in early July.
The 4-hour chart shows the pair consolidating in a tight range after the sharp downtrend that dominated May through early July: price at 1.14459 is now sandwiched almost exactly between the 50-period moving average at 1.14260 below and the 14-period at 1.14466 essentially at current price, with the 200-period average at 1.14727 capping things just overhead — a compressed, overlapping average structure that typically signals indecision rather than a clear trend, consistent with the choppy sideways action visible over the past week or so. The SMI mirrors that indecision: it’s been whipsawing between overbought and oversold on this timeframe for months (normal behavior on a fast chart), and its current reading of 24.44/16.77 shows momentum bouncing off an oversold trough with a mild positive divergence — the latest low in the indicator sat above the prior oversold extreme even as price chopped sideways to slightly lower, hinting at buyers slowly absorbing supply rather than sellers pressing the advantage. Given the moving averages are converging rather than trending and momentum lacks conviction in either direction, the fairest classification is neutral, with the near-term path likely to be range-bound until either the 200-period average at 1.14727 gives way to the upside or the 50-period at 1.14260 breaks to the downside. A push through 1.14727 would open a retest of the 1.15000 round number, while a break of 1.14260 would shift the short-term bias bearish and target 1.13800, the low from the recent range; traders positioning within the range should keep stops tight just beyond whichever boundary they’re fading, given how compressed the average cluster currently is.
We are glad you liked it
For your convenience, this will appear under your Saved articles in the top menu.