DAX
 13 Jul 2026
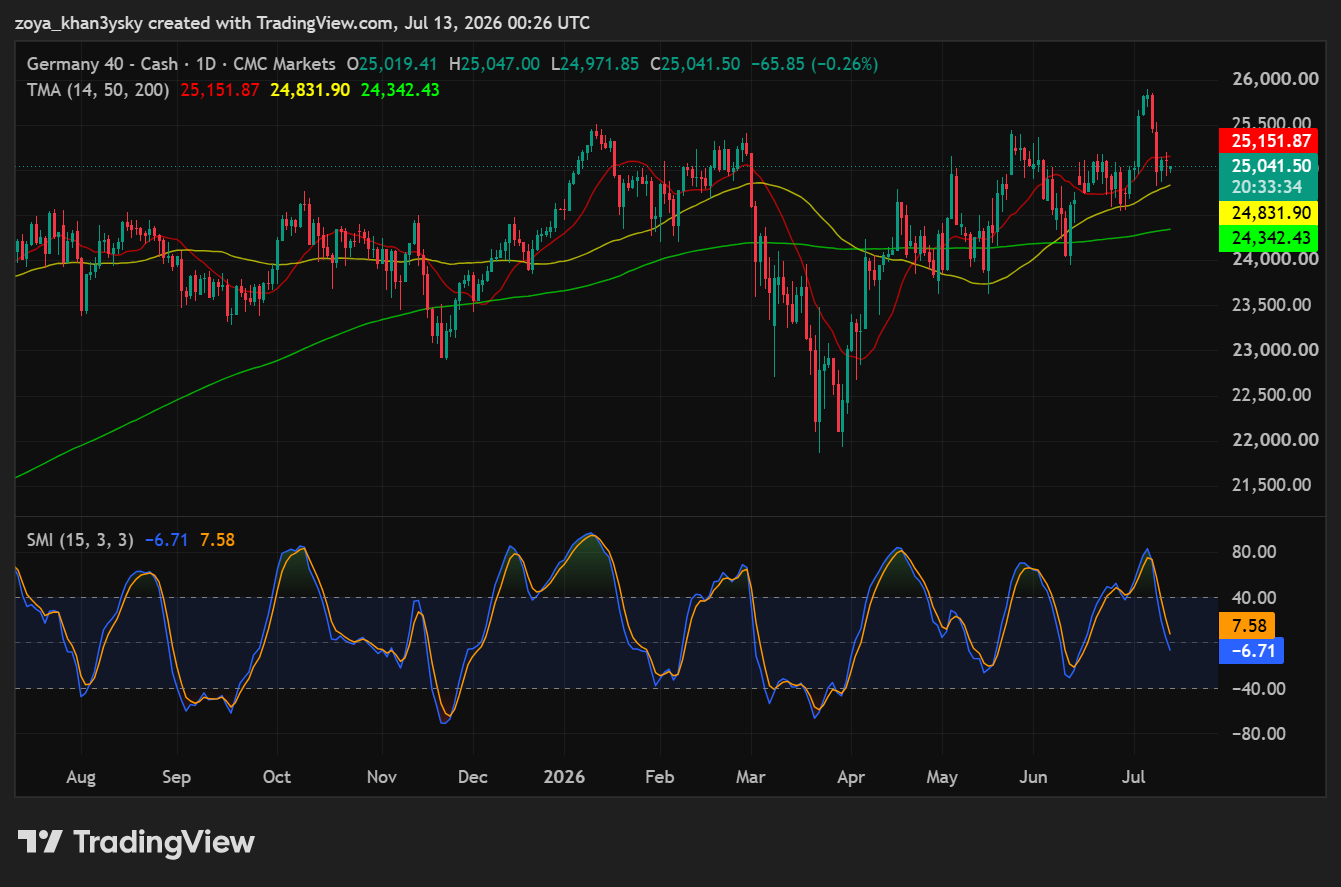
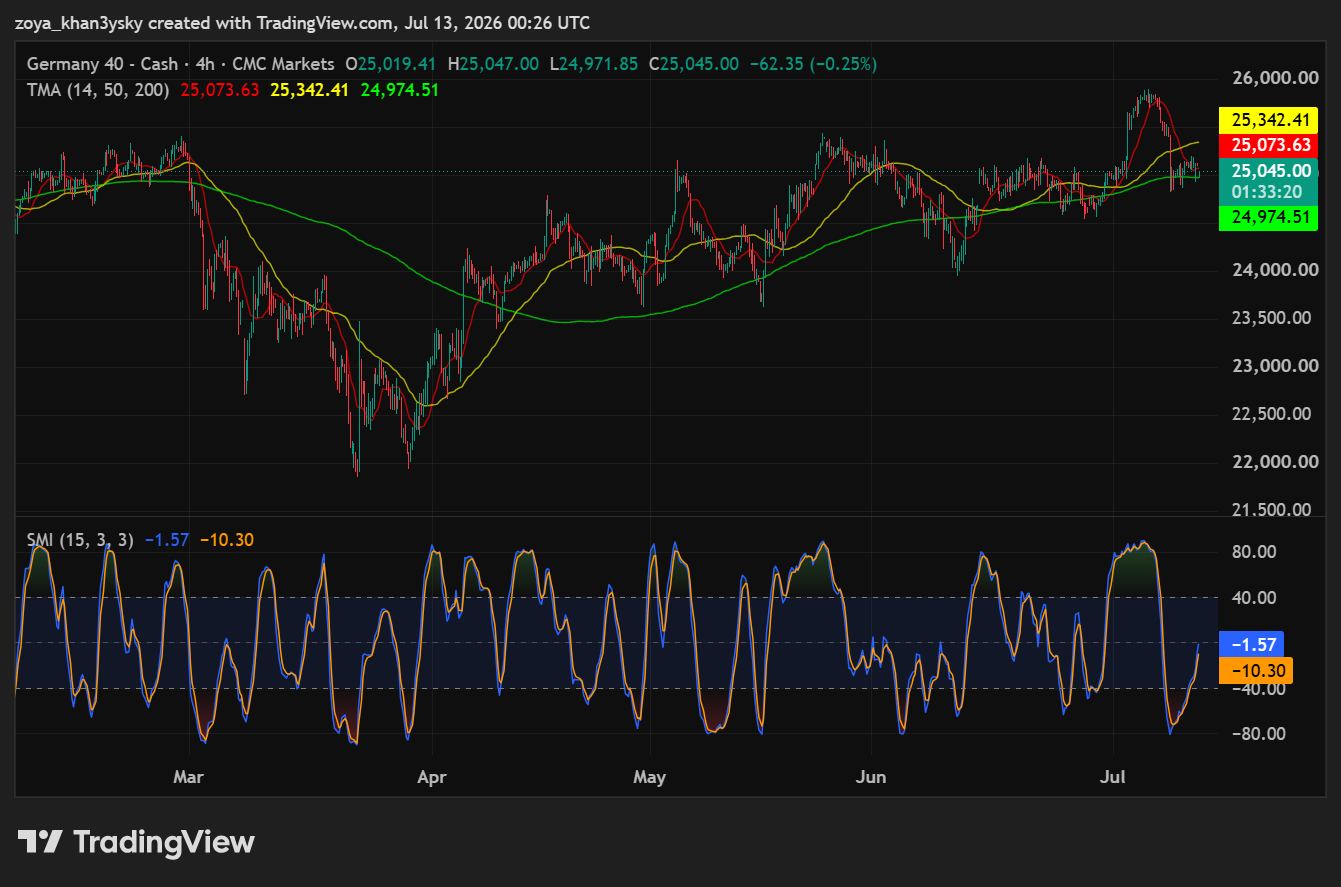
DAX: 4-hourly and daily chart technical view.
Daily Chart: Longer Term Bias: Bullish
| Resistance |
25,900 then 26,000 |
| Support |
24,831.90 then 24,342.43 |
4-Hour Chart: Short-Term Outlook: Bearish
| Resistance |
25,342.41 then 25,900 |
| Support |
24,974.51 then 24,700 |
Daily Chart: Longer-Term Bias: Bullish
4-Hour Chart: Short-Term Outlook: Bearish
Monday 13th July
The daily chart maintains a constructive longer-term structure, with the moving averages still stacked in bullish order — the 50-day (yellow, 24,831.90) sitting above the 200-day (green, 24,342.43) — confirming the broader uptrend that’s been in place since the March low near 22,000. Price has just pulled back from a fresh swing high around 25,900 and is now trading marginally below the 14-day MA (red, 25,151.87), which is a normal shallow retracement within an otherwise healthy trend rather than a structural break, since price remains comfortably above both the 50-day and 200-day averages that have supported every prior dip this year. The Stochastic Momentum Index has rolled over from overbought territory into slightly negative readings (-6.71/7.58), reflecting fading short-term momentum after the sharp run-up into the recent high — this is a mild bearish divergence (price near highs, momentum cooling) that argues for some consolidation or a shallow pullback rather than a trend reversal. A hold above the 50-day MA at 24,831.90 keeps the bullish case intact with a path back toward 25,900 and then the 26,000 round number; a stop just below the 50-day MA, near 24,750, would protect against a deeper correction while still giving the trend room to breathe.
The 4-hour chart tells a more cautious short-term story: price has broken back below both the 14-period (red, 25,073.63) and 50-period (yellow, 25,342.41) moving averages following a steep, parabolic-looking rally into the recent high, with only the 200-period MA (green, 24,974.51) — which price is now testing from above — still lending support to the intraday structure. This loss of the shorter averages after such a sharp advance is a classic sign of short-term exhaustion, and it’s confirmed by the Stochastic Momentum Index, which has dropped from deeply overbought levels down to -1.57/-10.30, a clear bearish momentum divergence where price made a new high but momentum failed to sustain the same intensity, warning that the rally outpaced itself. Immediate resistance now sits at the 50-period MA (25,342.41), which price would need to reclaim to reassert short-term strength, with the prior swing high at 25,900 as the larger hurdle above that; on the downside, a decisive break of the 200-period MA at 24,974.51 would open the door to the 24,700 support zone from the prior consolidation, and a stop just above the 50-period MA near 25,400 would be the logical level to manage risk against a renewed push higher.
Daily Chart: Longer-Term Bias: Bullish
4-Hour Chart: Short-Term Outlook: Bearish
Friday 10th July
The daily DAX chart remains structurally bullish despite the sharp two-week pullback from the recent spike toward ~25,650: price is trading above all three key moving averages, with the 14-day MA (red, 25,143.61) sitting just above spot, the 50-day MA (yellow, 24,809.04) further below acting as intermediate support, and the 200-day MA (green, 24,335.12) confirming the broader uptrend that’s been intact since the sharp April rebound off the ~22,000 low. This stacked-MA alignment — shorter-term averages above longer-term ones — is the textbook signature of a healthy uptrend, and each pullback this cycle has found buyers at or above the 50-day MA rather than breaking it. Momentum tells the cautionary part of the story, though: the Stochastic Momentum Index spiked into deeply overbought territory above 80 alongside the recent push to new highs, and has now rolled over sharply to 4.97/21.83 as price corrected — this is a normal overbought unwind rather than a bearish divergence, since price and momentum both peaked together and are now both retreating in sync. Given the trend structure is still intact, the bias favors buying this pullback rather than fading the uptrend, with an upside target back toward 25,650 and eventually 26,000 if the rally resumes; a stop below the 50-day MA at 24,809 protects against the correction turning into a deeper trend break, since a close beneath that level would be the first real technical evidence the longer-term uptrend is losing control.
The 4-hour chart shows a short-term bearish correction unfolding after the sharp rally that carried price from roughly 24,900 to 25,650 in the span of just a few sessions: that move was too fast to sustain, and price has since pulled back below both the 14-period MA (red, 25,125.33) and the 50-period MA (yellow, 25,315.03), which now sit overhead as resistance rather than support — a shift that typically signals the immediate momentum has flipped from buyers to sellers. The 200-period MA (green, 24,980.23) is the key level to watch, since it sits just below current price and represents the last line of defense for the short-term uptrend on this timeframe; a break below it would open a deeper retracement. Momentum confirms the near-term weakness: the Stochastic Momentum Index collapsed from deeply overbought levels above 80 down to -41.82/-47.84, one of the sharpest momentum reversals on the chart, indicating the recent rally has fully exhausted itself and sellers are now in control on this timeframe. Given this setup, the short-term bias favors caution or a tactical short rather than chasing the prior rally, with a downside target near 24,700 (the last consolidation shelf before the breakout) if the 200-period MA fails to hold; a recovery back above 25,315 would invalidate this bearish read and suggest the correction is already over. A stop placed above 25,315 (above the 50-period MA) keeps risk contained against the level that currently caps the short-term bounce.
We are glad you liked it
For your convenience, this will appear under your Saved articles in the top menu.