EUR/USD
 30 Jun 2026
EUR/USD: 4-hourly and daily chart technical view
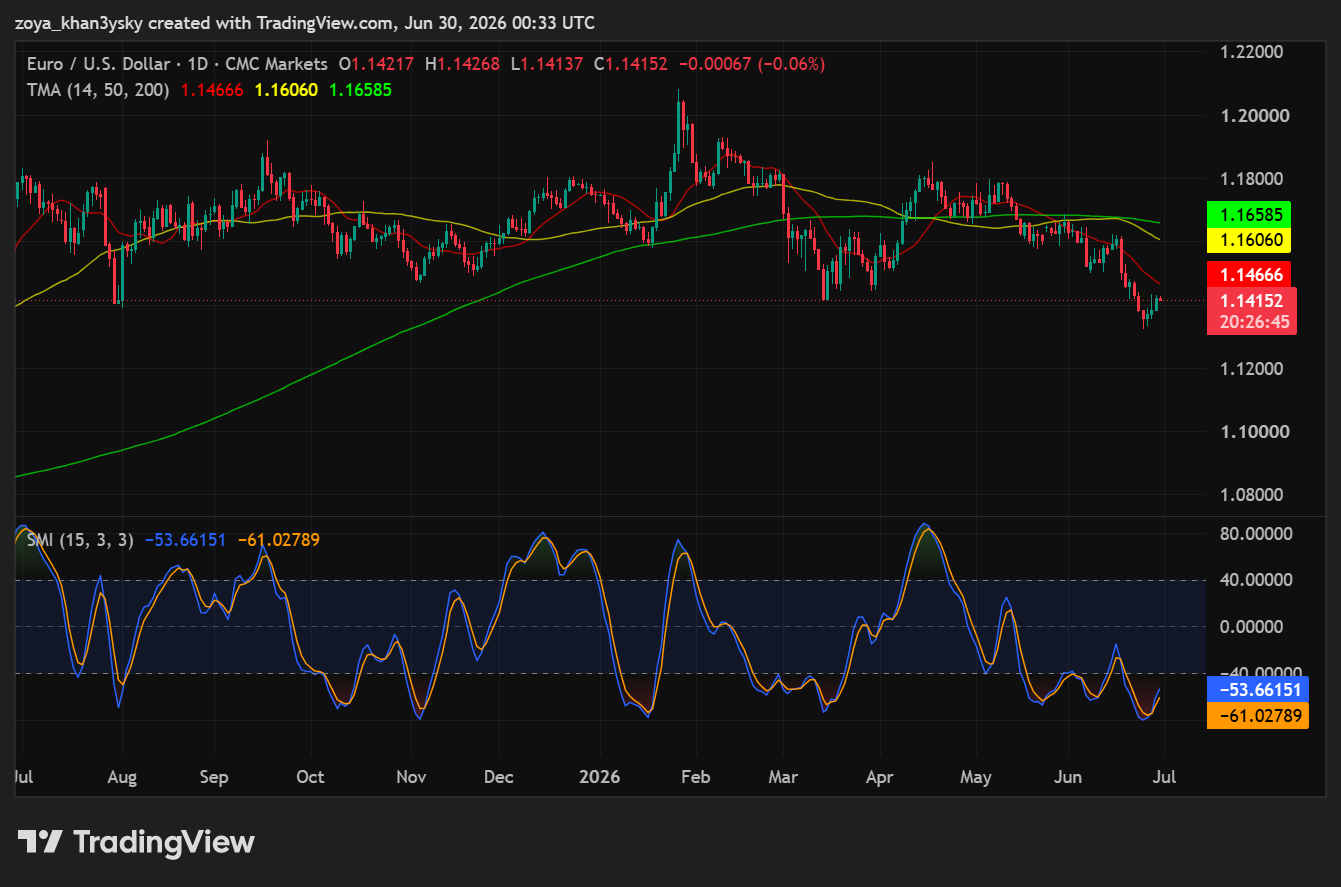
Daily Chart: Longer Term Bias: Bearish
| Resistance |
1.14666 then 1.16060 |
| Support |
1.13500 then 1.12000 |
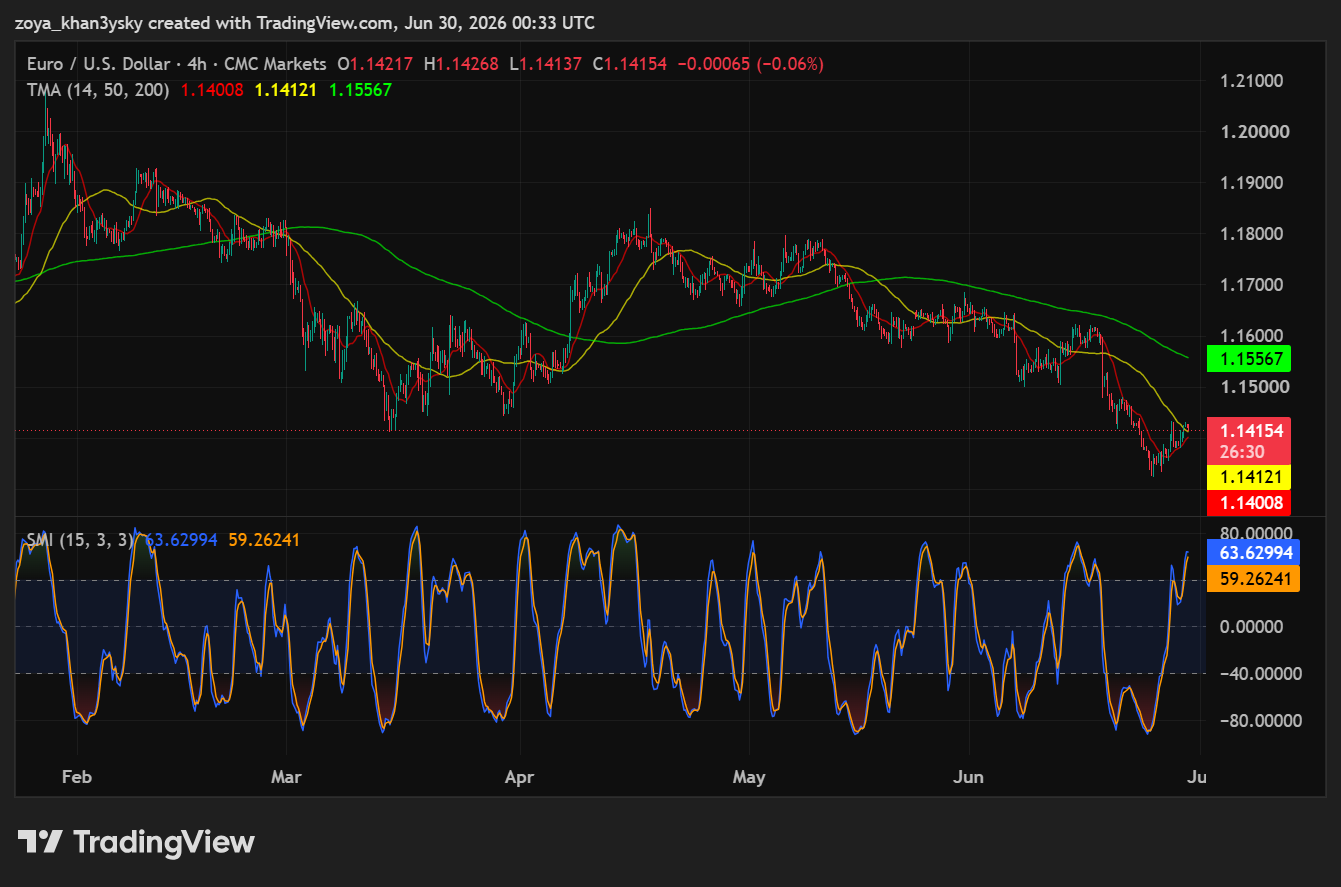
4-Hour Chart: Short-Term Outlook: Neutral
| Resistance |
1.14121 then 1.15567 |
| Support |
1.13500 then 1.13000 |
Daily Chart: Longer-Term Bias: Bearish
4-Hour Chart: Short-Term Outlook: Neutral
Tuesday 30th June
The daily chart for EUR/USD presents a bearish longer-term bias, with price currently trading at 1.14152 — below all three TMAs in a negatively aligned configuration that confirms the structural deterioration from the February 2026 peak near 1.2050. The 14-day TMA (red) at 1.14666 sits immediately above current price and represents the most critical near-term dynamic resistance level; price has been consistently rejected below this declining average throughout June 2026, reinforcing its role as a reliable ceiling for intraday rallies. The 50-day TMA (yellow) at 1.16060 and the 200-day TMA (green) at 1.16585 form a tightly converged overhead resistance cluster in the 1.1606–1.1659 zone — notably, the 50-day and 200-day TMAs are nearly identical in value and both declining, which signals that medium- and long-term momentum are aligned to the downside; the fact that the 50-day has crossed below the 200-day represents a bearish “death cross” equivalent on the TMA framework, a structurally significant development that institutional trend-following participants treat as confirmation of a sustained downtrend. Price is currently testing a historically important horizontal support shelf around the 1.1400–1.1415 area, which also corresponds to the October–November 2025 consolidation lows; a confirmed daily close below 1.1400 would constitute a decisive structural breakdown and expose the next meaningful support zone near 1.1350, with a broader measured move objective toward 1.1200 if selling momentum accelerates. The SMI reads -53.66 (signal) and -61.03 (fast line) — both declining and embedded in oversold territory — however, no bullish divergence is present: the fast line is making new lows in synchrony with price, which confirms that bearish momentum remains dominant and the oversold reading reflects trend strength rather than approaching exhaustion; this is a bearish momentum continuation signal, not a reversal warning. Traders with a bearish directional bias should target 1.1350 as the primary downside objective and 1.1200 as the extended target, placing stop losses above the 14-day TMA at 1.1467 to define risk against any short-covering bounce.
The 4-hour chart for EUR/USD presents an intriguing and analytically important divergence from the bearish daily narrative: while the structural trend remains downward, the short-term momentum configuration is flashing a cautionary signal that warrants a neutral rather than outright bearish short-term classification. Price at 1.14154 is trading fractionally above the 14-period TMA (red) at 1.14008 and the 50-period TMA (yellow) at 1.14121 — both of which are essentially confluent with current price — indicating that the immediate short-term trend is in a transitional phase rather than in active downside continuation. The 200-period TMA (green) at 1.15567 remains well above current price and is declining, continuing to act as significant medium-term dynamic resistance that would need to be reclaimed to alter the broader bearish structural outlook. The key analytical element on the 4-hour chart is the SMI reading of 63.63 (signal) and 59.26 (fast line) — both positioned in overbought territory above the 40–50 threshold — which stands in sharp and meaningful contrast to the deeply oversold daily SMI; this cross-timeframe SMI divergence is a critical signal, as it indicates that the most recent short-term price decline has generated an oversold bounce on the 4-hour that has now driven momentum into overbought territory, creating a classic short-term countertrend rally within a broader downtrend. The fast SMI line (63.63) trading above the signal line (59.26) confirms the bullish 4-hour momentum crossover is still active, suggesting the near-term bounce has further potential to probe the 50-period TMA resistance at 1.14121 and possibly the 200-period TMA at 1.15567 before exhausting. However, the overbought 4-hour SMI against a bearish daily SMI context means the risk of a renewed downside resumption is elevated — traders should remain neutral on the 4-hour, avoiding fresh shorts until the SMI rolls over from overbought and price fails below 1.14008, at which point the bearish daily bias would be expected to reassert with downside targets at 1.1350 and 1.1300, using stops above 1.14666 to manage risk.
Daily Chart: Longer-Term Bias: Bearish
4-Hour Chart: Short-Term Outlook: Neutral
Monday 29th June
The daily chart for EUR/USD presents a bearish longer-term bias, with price currently trading at 1.13856 — below all three key TMAs and within proximity of a significant horizontal support shelf that has acted as a structural floor across multiple prior consolidation episodes visible on the chart. The 14-period TMA at 1.14726 (red) represents the most immediate dynamic resistance and has been actively capping recovery attempts throughout June, with the pair consistently failing to sustain closes above this level since the May breakdown began; the 50-period TMA at 1.16119 (yellow) and the 200-period TMA at 1.16603 (green) have now converged in a tight band around 1.1612–1.1660, creating a formidable overhead resistance cluster that would require a substantial fundamental shift — likely driven by a meaningful change in ECB or Fed policy expectations — to breach on a sustained basis. The price trajectory from the April 2026 highs near 1.1800 has been a well-ordered sequence of lower highs and lower lows, with the most recent acceleration lower through June confirming that the dominant trend remains firmly to the downside and that the pair has now broken below the prior horizontal support visible near 1.1400 on a closing basis, a development that technically converts that level from support into resistance. The SMI at -68.32 (blue line) and -71.46 (signal line) is deeply in oversold territory, and the signal line sitting below the blue line confirms that negative momentum remains unabated — critically, when comparing the current SMI readings with the prior oversold troughs visible at the August 2025 lows (-60 region) and the October 2025 lows (-50 region), the current reading is the most extreme on the chart, yet price is not at a correspondingly extreme low, which could be interpreted as a mild form of bearish momentum exhaustion; however, the absence of a classic bullish divergence — where price makes a fresh low while the SMI forms a higher low — means this observation warrants monitoring rather than acting upon, and traders should not interpret the oversold SMI as a reversal signal in isolation. The dotted horizontal support near 1.1300 represents the immediate downside target and aligns with a prior consolidation zone from late 2025 price action, with a deeper structural target at 1.1200 should selling pressure persist beyond this level. Traders maintaining a bearish bias should use a stop loss above the 14-period TMA at 1.1473, as a sustained daily close above this dynamic resistance would signal a meaningful recovery and require reassessment of the directional thesis.
The 4-hour chart for EUR/USD presents a nuanced neutral short-term outlook, as the most recent price action shows the pair attempting to stabilize and potentially base following the sharp June decline, with the SMI generating a meaningful recovery signal that introduces short-term ambiguity to what remains a structurally bearish setup on higher timeframes. Price is currently trading at 1.13861, sitting just above the 14-period TMA at 1.13786 (red) — a notable development because this is the first sustained instance in recent weeks where price has been trading at or above the 14-period TMA, which has previously capped every intraday bounce throughout the June downtrend; this proximity suggests that the short-term momentum balance is beginning to shift even if the broader trend remains bearish. The 50-period TMA at 1.14307 (yellow) represents the next critical resistance level, as this moving average has been sloping downward throughout May and June and has not been tested from below since the early June breakdown, making it a key level that bulls would need to reclaim on a 4-hour closing basis to shift the short-term outlook from neutral to bullish; the 200-period TMA at 1.15651 (green) remains a distant overhead resistance aligned with the daily TMA cluster and is unlikely to be tested in the near term without a significant catalyst. The SMI at 19.947 (blue line) and 26.437 (signal line) is the most critical piece of evidence underpinning the neutral classification — the indicator has recovered sharply from the deeply oversold levels near -80 that were reached in mid-to-late June, with the signal line now crossing above the blue line in a bullish SMI crossover, a technical configuration that has historically preceded short-term bounces of 100–200 pips in EUR/USD when occurring after extreme oversold readings. This SMI recovery from extreme oversold territory while price simultaneously stabilizes near the 14-period TMA constitutes a mild bullish divergence at the 4-hour level — the prior SMI trough in mid-June reached near -80 while the current price low appears comparable or marginally lower, yet the SMI is recovering more aggressively, indicating that selling momentum is losing intensity and a consolidation or corrective bounce toward 1.1431 is plausible in the near term. However, the enduring bearish structure of all three TMAs — with the 14-period, 50-period, and 200-period all sloping downward — means any recovery should be treated as a counter-trend move rather than a trend reversal, and traders should remain cautious about initiating outright long positions until price can sustain a close above the 50-period TMA at 1.1431. For traders positioned short from higher levels, a stop loss above 1.1431 is recommended to protect against the counter-trend bounce, while the primary downside targets of 1.1350 and 1.1300 remain intact as long as price continues to respect the bearish TMA structure on 4-hour closes.
Friday 26th June
The daily chart for EUR/USD presents a bearish longer-term bias, with price currently at 1.13650 trading below all three TMAs — the 14-period at 1.14825, the 50-period at 1.16196, and the 200-period at 1.16623 — a bearish TMA alignment that confirms the dominant trend has shifted decisively in favour of USD strength following the pair’s failure to sustain the February 2026 peak above 1.2000, with price now in a well-defined sequence of lower highs and lower lows from that peak. Of particular technical significance is the positioning of the 50-period and 200-period TMAs at 1.16196 and 1.16623 respectively, as their proximity creates a dense overhead resistance cluster in the 1.162–1.166 zone that represents a formidable barrier to any recovery attempt; this cluster acted as the pivot zone from which the most recent leg lower accelerated in June, reinforcing its validity as resistance on a retest. The 14-period TMA at 1.14825 serves as the nearest overhead resistance, and the fact that price is trading approximately 120 pips beneath even this shortest-term average underscores the degree of bearish momentum currently present on the daily structure. Price is now approaching and testing a critical horizontal support ledge near 1.1320–1.1360 that corresponds to the March 2026 reaction low, and a sustained daily close below 1.1320 would represent a significant technical breakdown opening the path toward 1.1200 — the next meaningful support zone identified from prior consolidation history. The Stochastic Momentum Index is deeply oversold at -76.39 (signal) and -76.22 (smoothed), readings comparable in depth to the August 2025 and October 2025 oversold troughs that each preceded temporary bounces; however, critically, there is no bullish divergence forming at this stage — both price and the SMI are declining in synchrony to new cycle lows, which means the oversold condition reflects the strength of the downtrend rather than signalling exhaustion, and traders should not treat oversold SMI readings alone as a reversal trigger in a trending environment. Traders with a bearish bias should target 1.1320 as the immediate support test, with a breakdown objective toward 1.1200; a stop loss placed above the 14-period TMA at 1.14825 is recommended, as a daily close above that level would indicate near-term bearish momentum is fading and warrant reassessment of short positioning.
The 4-hour chart for EUR/USD confirms the bearish short-term outlook, with price at 1.13654 trading below all three TMAs — the 14-period at 1.13623, the 50-period at 1.14600, and the 200-period at 1.15766 — all of which are sloping downward in a negatively aligned sequence that provides a cascading resistance structure above current price, with each average representing a progressively higher barrier that sellers have consistently defended throughout the June decline. The 14-period TMA at 1.13623 is essentially at current price levels, indicating that even the shortest-term dynamic average is offering no upside cushion and that the pair is trading at the leading edge of its own downtrend momentum — a configuration that typically signals continuation rather than reversal. The 50-period TMA at 1.14600 and 200-period TMA at 1.15766 both represent meaningful overhead resistance zones where short-side re-entry opportunities would be technically valid if price were to retrace toward them. The Stochastic Momentum Index reads -15.94 (signal) and -24.44 (smoothed), placing it in the lower-neutral to mildly oversold zone on the 4-hour timeframe — notably less extreme than the daily reading of -76, which reflects that the 4-hour SMI has oscillated more frequently and has not yet reached its oversold floor on this current leg lower, meaning there is meaningful additional downside momentum capacity available before the indicator reaches exhaustion territory near -80. The signal line at -15.94 is above the smoothed line at -24.44, creating a minor bearish spread that suggests the smoothed momentum is still decelerating faster than the signal, consistent with sustained selling pressure rather than a stabilising market; there is no positive divergence between price and the SMI on this timeframe, as both continue to make lower readings in alignment with the prevailing downtrend. Traders should target 1.1320 as the immediate downside objective representing the key horizontal support test, with an extended target at 1.1200 on a sustained break below; a stop loss positioned above the 50-period TMA at 1.14600 is recommended for short positions, as a 4-hour close above that level would indicate a meaningful short-term trend shift and invalidate the current bearish structure.
We are glad you liked it
For your convenience, this will appear under your Saved articles in the top menu.