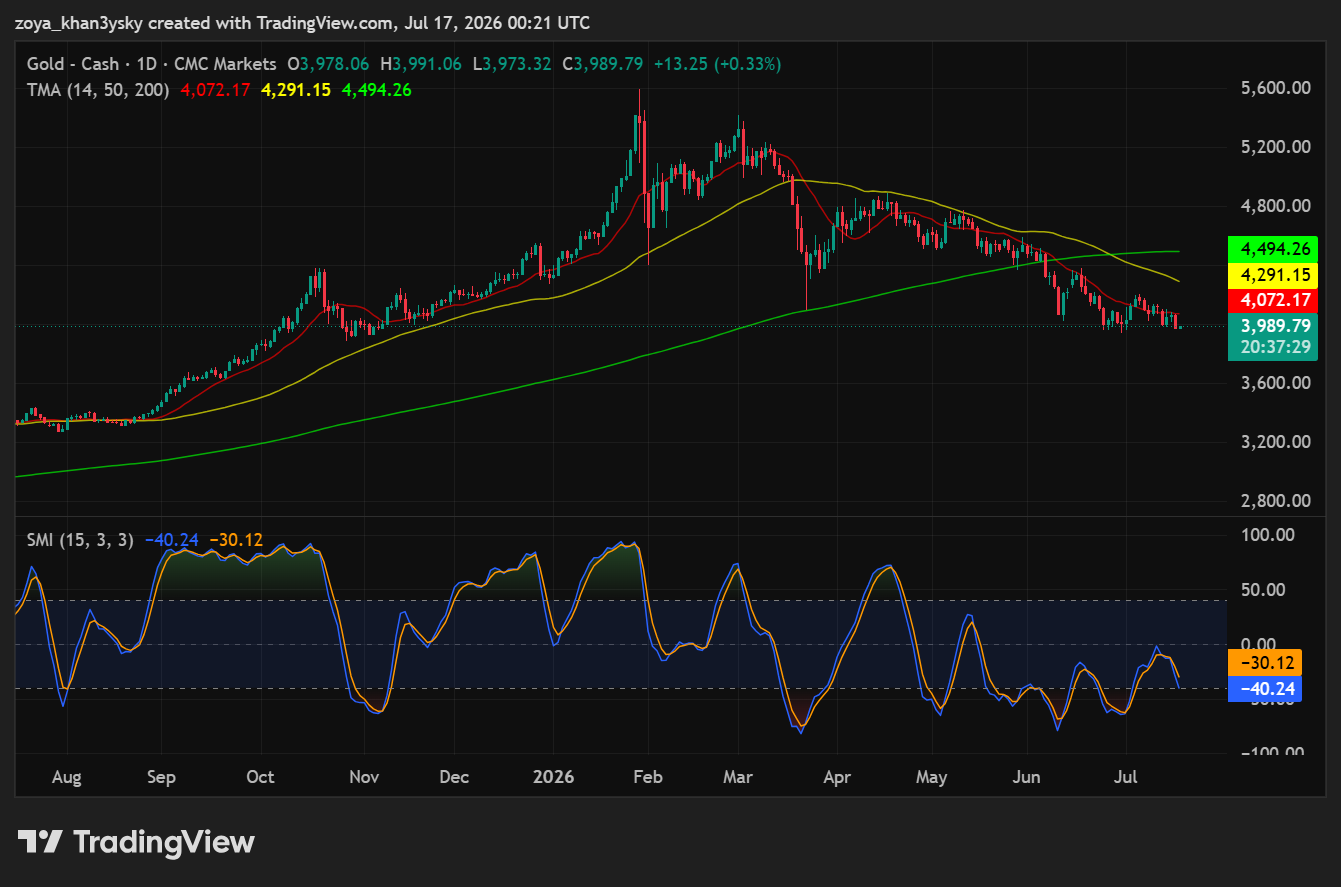
Daily Chart: Longer-Term Bias: Bearish
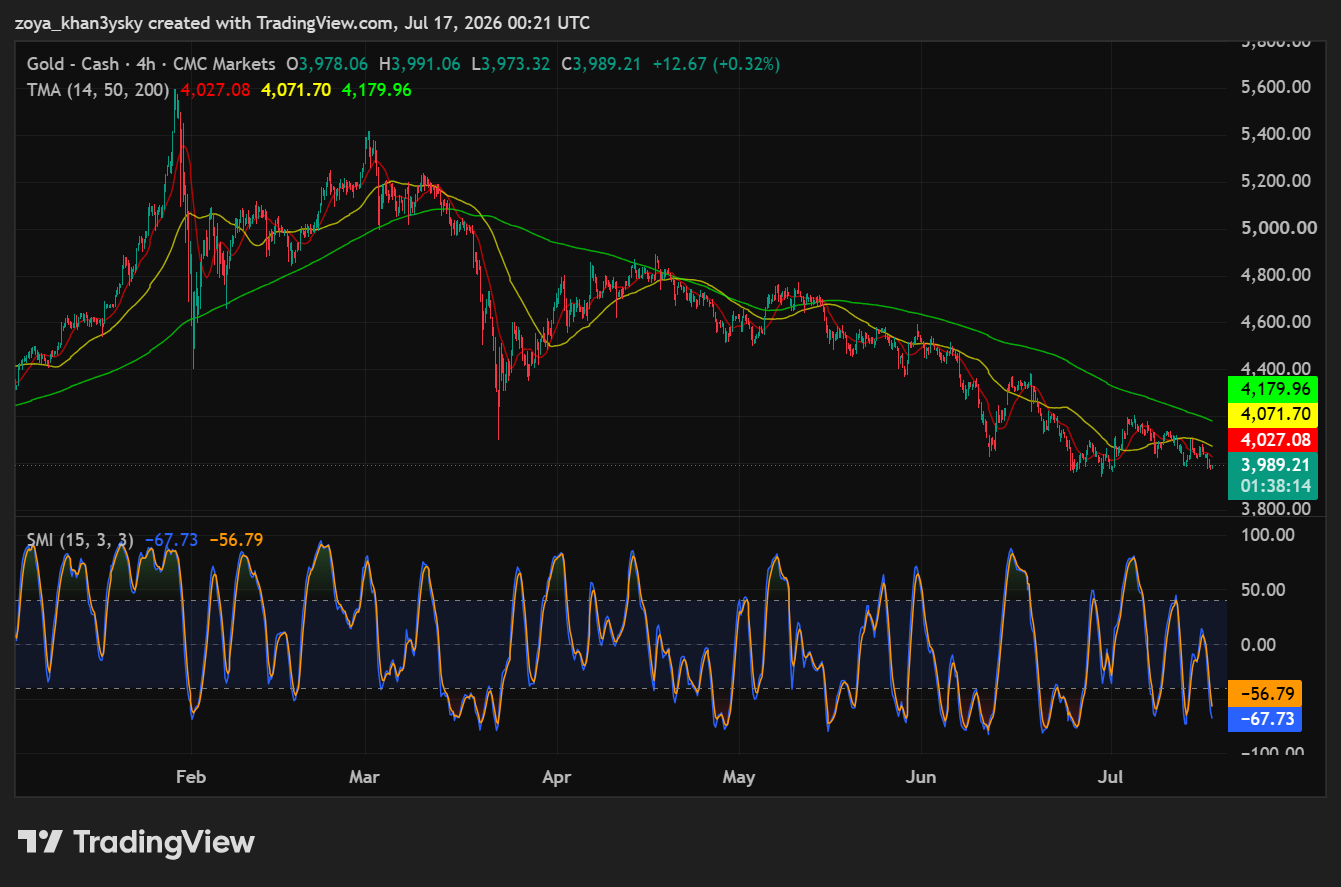
4-Hour Chart: Short-Term Outlook: Bearish
Friday 17th July
The daily chart shows gold in a well-established longer-term downtrend, with price at 3,989.79 trading beneath all three moving averages in a clean bearish stack — the 14-day TMA at 4,072.17 sits below the 50-day at 4,291.15, which sits below the 200-day at 4,494.26 — confirming that sellers have controlled the tape since the sharp reversal off the roughly 5,700 high made back in February. The 14-day average is the first hurdle overhead and now functions as dynamic resistance; a reclaim of it would need to be followed by a push through the 50-day near 4,291 before the longer-term structure could be called anything other than bearish, with the 200-day at 4,494 marking the level that would need to fall to really challenge the downtrend. What keeps this from being a straightforward “sell any bounce” picture is the Stochastic Momentum Index: its recent troughs (April, May, June) have been carving out progressively shallower lows even as price itself kept grinding to new lows into July, a classic bullish momentum divergence that suggests the pace of the decline is losing energy even though price hasn’t confirmed a turn yet. With the SMI reading -40.24/-30.12 and curling up from oversold rather than sitting deep in it, the more prudent read is a market that’s due a relief bounce or basing period rather than an imminent trend reversal — so the bias remains bearish-to-neutral until price closes back above the 50-day average. A conservative approach would favor fading strength into the 4,072–4,291 zone rather than chasing the current level, targeting a retest of the 3,900 psychological support and then the 3,700 area (the prior base from last summer) if the downtrend resumes, with a stop placed above the 200-day TMA near 4,500 for anyone positioning short, since a close back above that average would invalidate the bearish structure.
The 4-hour chart reinforces the same bearish picture on a tighter timeframe: price at 3,989.21 is again stacked below all three moving averages, with the 14-period TMA at 4,027.08, the 50-period at 4,071.70, and the 200-period at 4,179.96 all sloping downward, which is a textbook signal of persistent short-term selling pressure and confirms the daily downtrend is intact at the intraday level rather than being contradicted by it. Unlike the daily SMI, the 4-hour Stochastic Momentum Index doesn’t show a clean divergence — it’s been whipsawing rapidly between overbought and oversold extremes for months, which is normal on a fast timeframe and means it’s better used here to time entries than to call trend changes; currently it’s printing -67.73/-56.79, deep in oversold territory, which typically precedes at least a short-lived bounce or consolidation rather than an immediate extension lower. Given that, the near-term path of least resistance still favors the downside, but chasing shorts right at current levels into an oversold reading carries elevated risk of a squeeze back toward the 14-period average. A more measured approach would be to look for a bounce into the 4,027–4,072 resistance band (where the 14- and 50-period averages converge) as a better-risk opportunity to align with the broader downtrend, targeting a break of today’s low near 3,973 and then the 3,900 support, with a stop placed just above 4,072 to protect against a short-term reversal back through both moving averages.
Daily Chart: Longer-Term Bias: Bearish
4-Hour Chart: Short-Term Outlook: Bearish
Thursday 16th July
The daily chart has shifted decisively from the prior bullish channel into a bearish trend structure: price closed at 4,059.92, sitting below all three key moving averages — the 14-day (4,080, red), 50-day (4,307, yellow), and 200-day (4,495, green) — which are now stacked in bearish sequence (14 < 50 < 200) after the 200-day rolled over from its earlier uptrend. That inversion is significant because it confirms the multi-month advance from below 3,600 to above 5,300 has given way to a corrective/distribution phase, with the moving averages that once acted as support now converging overhead as resistance. The Stochastic Momentum Index is reading -12.42/-12.37 — below the zero line but off its deepest oversold extremes from earlier pullbacks, and showing early signs of curling higher without price making a corresponding new high. That’s a mild bullish momentum divergence (momentum stabilizing while price consolidates near the lows), which argues against chasing the downside here but isn’t yet strong enough to call a trend reversal. Given the structure, the near-term path of least resistance stays lower-to-sideways: a failure to reclaim the 14-day average (4,080) keeps sellers in control, with the 50-day (4,307) as the first real test of trend character, and the 200-day (4,495) as the level that would need to be reclaimed to negate the bearish bias. Downside, the market is pressing into the zone that capped and then supported price during the initial breakout (roughly 3,950–4,000); a clean break there opens the door back toward the 3,600 area where the original rally began. Traders positioning short would look to use a stop above the 50-day MA (~4,320) to protect against a momentum-driven squeeze back toward the moving-average cluster; those looking for a reversal trade would want to see the SMI cross back above zero with price closing back over 4,080–4,100 before treating this as more than a short-term bounce.
On the 4-hour timeframe, price (4,060.14) is threading between its short-term moving averages, sitting just above the fast 14-period MA (4,043) but still capped by the 50-period (4,091) and 200-period (4,196) averages, which remain stacked bearishly overhead — the same descending alignment seen on the daily, confirming the higher-timeframe downtrend is still the dominant force. What’s notable here is the momentum picture: the Stochastic Momentum Index has climbed to 19.67/12.55, well up from the deeply oversold readings that accompanied the sharp February–April decline, and price has been carving a series of higher lows since the April washout even as it stays below the moving-average cluster. That’s a constructive short-term divergence — momentum improving faster than price is recovering — consistent with basing/consolidation rather than continued free-fall, but it’s happening beneath resistance rather than confirming a trend change. This favors a neutral-to-cautiously-bullish short-term stance: a break and hold above the 50-period MA (4,091) would open a test of the 200-period MA (4,196), which is the level that matters for signaling the intermediate downtrend is actually stalling. On the other hand, a loss of the 14-period MA (4,043) with the SMI rolling back down would suggest the bounce is exhausting and put the recent range low (~3,975) back in play, aligning with the daily support zone. A tactical long here would look to control risk with a stop below 4,020–4,040 (under the 14-period MA and recent higher low), while a short back toward trend would wait for confirmation at the 4,091–4,196 resistance band rather than fighting the current short-term momentum recovery.
Wednesday 15th July
The daily chart tells a clear story of a parabolic rally that has run out of steam. Gold surged from roughly 3,600 to a spike high above 5,600 into February 2026, but has been in a sustained downtrend since, and price is now trading below all three moving averages — the 14-day (red) at 4,082, the 50-day (yellow) at 4,320, and the 200-day (green) at 4,494. That stacking, with shorter MAs below longer ones, is a textbook bearish alignment: each of those levels now represents overhead resistance rather than support, since price would need to reclaim them in sequence to repair the trend. The Stochastic Momentum Index is sitting around -14.6, well off its 2026 extremes but not yet in oversold territory (below -40), which it has visited several times this year on sharper legs down. That leaves room for further downside before momentum becomes stretched. There’s no clean bullish divergence forming yet — price is still making a similar low to prior swings while the SMI hasn’t meaningfully outperformed — so this reads as a continuation setup rather than a reversal signal. A break of the current 4,047 area would open the door toward a retest of the 3,600 zone where the prior basing/breakout region sits, while a recovery back above 4,320 would be needed to suggest the correction is over. Anyone leaning short here would typically look to protect against a squeeze back above the 14MA (~4,082), since a reclaim there would undercut the bearish thesis.
The 4-hour timeframe shows the same structural weakness in higher resolution: price is consolidating just under the 14-period MA (4,047), with the 50-period (4,104) and 200-period (4,209) MAs both sloping downward above it, reinforcing the broader downtrend. The SMI here is choppier, as expected on a shorter timeframe, currently around -4.4, essentially straddling the zero line after cycling through several overbought/oversold swings this year — it’s neither confirming fresh downside momentum nor flashing a clear bullish reversal signal, which suggests near-term consolidation or indecision rather than a strong directional push in either direction right now. If price loses the current 4,047 support, the next area of interest is the low-4,000s where prior 4-hour consolidation occurred; a move back through 4,104 and then 4,209 would be needed to shift the short-term picture toward neutral-to-bullish. Given the choppiness of the SMI on this timeframe, a stop just above the 50-period MA (4,104) is the more conservative placement for a short-side approach, since that’s the first level where trend-following buyers would likely start stepping back in.
Tuesday 14th July
Gold’s daily chart has broken down decisively from the parabolic run that peaked near 5,600 in February, and price (3,998.17) is now trading below all three moving averages — the 14-period (4,075.88), 50-period (4,331.41), and 200-period (4,493.01) — with the shorter averages stacked beneath the longer ones in a clean bearish alignment. That configuration typically confirms a trend that has fully transitioned from bullish to corrective, and here it’s especially notable given the size of the prior rally, since deep corrections after parabolic moves often retrace a significant portion of the advance. The Stochastic Momentum Index sits at -22.31/-16.05, negative but not yet at a true oversold extreme, and it has largely mirrored price’s decline rather than showing a bullish divergence (price is grinding to new multi-month lows without the SMI carving out a higher low), so momentum is confirming the downtrend rather than flagging an imminent reversal. That said, a reading this close to the oversold zone does raise the likelihood of at least a near-term bounce or period of consolidation before any further slide. A close back above the 4,075.88–4,331.41 MA band would be needed to materially improve the picture; barring that, the path of least resistance stays lower, with the recent low near 3,983.61 as the immediate support to watch and the 3,600 area as a deeper target if the decline extends. A trader leaning bearish here might place a stop above the 14-period MA (roughly 4,075) to manage risk against a sharp reversal.
The 4-hour chart reinforces the daily’s bearish structure with even more clarity: price (3,997.55) is below the 14-period (4,072.28), 50-period (4,105.90), and 200-period (4,220.46) moving averages, and the steady sequence of lower highs since the failed rally attempt in late June/early July confirms sellers remain in control on the intraday timeframe. The Stochastic Momentum Index here is at -67.43/-77.72, a genuinely oversold reading that has repeatedly triggered short-lived bounces on this chart over the past several months — so while the trend is clearly down, this level of momentum extension does raise the odds of at least a short-term relief rally. Whether that turns into more than a pause depends on whether price can reclaim the 4,072–4,106 MA cluster; failing that, the oversold reading alone isn’t enough to call a bottom, since deeply oversold momentum can persist through a strong downtrend, as it has repeatedly on this chart already. Near-term support sits at the recent low around 3,983.61, with a further downside extension toward 3,850 if that level gives way. Resistance is layered at 4,072.28, then 4,105.90, then the more significant 4,220.46 level where the 200-period MA caps the chart. A trader positioned bearish might use a stop just above the 50-period MA (~4,106) to allow room for a normal oversold bounce while still limiting risk if the trend reasserts itself to the downside.
Monday 13th July
The daily chart shows gold in a clear downtrend after topping out near 5,600 in February 2026. Price has broken decisively below all three moving averages — the 14-day (red, 4,082), 50-day (yellow, 4,344), and 200-day (green, 4,493) — and those averages have now rolled over into a bearish stack (14 below 50 below 200), which typically confirms a trend reversal rather than a temporary pullback. Current price (4,080.27) is sitting essentially on top of the 14-day average, with the 50-day and 200-day now overhead acting as resistance rather than support — a role reversal common after a major breakdown. The Stochastic Momentum Index is hovering near the zero line (2.89/-3.57), having bounced out of deeply oversold territory reached earlier in the decline; this reflects stabilizing downside momentum rather than a confirmed bullish reversal, since a sustained move above the SMI’s signal line would be needed to validate a base. Immediate support sits at the recent swing low of 4,068, with the round-number 4,000 level as the next downside area to watch if selling resumes; on the upside, a reclaim of the 50-day MA near 4,344 would be the first meaningful sign the downtrend is losing conviction.
On the 4-hour timeframe, price is carving out a basing pattern after months of steady decline. The 14-period (4,104.20) and 50-period (4,104.19) moving averages have converged almost exactly, a classic sign of trend exhaustion and a potential inflection point, while the 200-period average (4,234.75) remains well above price, keeping the broader intraday structure technically bearish until that gap closes. The Stochastic Momentum Index reading of 35.51/37.71 sits in neutral-to-firm territory — not overbought — suggesting the recent stabilization has room to extend without immediate exhaustion risk, though it isn’t yet flashing a strong bullish divergence signal. A break and hold above the converged 4,104 moving-average cluster would open the door toward the 200-period average near 4,235; failure to hold current levels would put the 4,069 low back in focus, with 3,850 as the next lower support zone from the prior consolidation.
Friday 10th July
The daily chart is still structurally bearish after the violent reversal from the ~5,650 blow-off top: price collapsed through both the 50-day MA (yellow, 4,353.11) and the 200-day MA (green, 4,491.64) during the Feb–Apr decline, and both averages remain stacked above spot (4,122.30), which keeps them acting as overhead resistance rather than support. That said, the character of the move has changed over the last several weeks — the 14-day MA (red, 4,083.95) has flattened out and price has started chopping sideways just above it in the 4,050–4,200 band instead of making fresh lows, which is the first sign of supply/demand equilibrium after a steep trend. The more important tell is on the Stochastic Momentum Index: it plunged into deeply oversold territory (below -80) in June, and while price kept probing the same low area on subsequent tests, the SMI has been printing higher lows and is now curling back up through -1.51/-9.83 toward the zero line — a bullish momentum divergence relative to price, which is a classic early-reversal signature even though it doesn’t override the still-bearish moving-average structure. Given that, the near-term bias favors a basing/reversal attempt rather than continuation of the downtrend, but confirmation requires a daily close back above the 50-day MA (4,353) to shift the intermediate trend bullish; failure to hold the 4,000–4,050 shelf would instead open the door to a retest of the 3,600 breakout base. A conservative approach here is to wait for that MA reclaim before adding long exposure, using a stop on the 4,000 level (below the recent basing range) to invalidate the reversal thesis, while a break of 3,600 would be the level that fully negates the longer-term bullish structure built since 2025.
The 4-hour picture is more constructive right now: after grinding lower for months inside a well-defined descending channel, price has recently pushed back above both the 14-period MA (4,097.74) and 50-period MA (4,092.64), which have essentially converged — a short-term bullish crossover that reflects the recent basing action. The 200-period MA (green, 4,248.11) is still well overhead and marks the level that needs to be reclaimed to argue for anything more than a corrective bounce within the larger downtrend. Momentum supports the near-term bullish case: the Stochastic Momentum Index is at 25.54/15.53, positive and rising, having climbed out of the oscillating oversold/neutral chop that dominated the last few months — it’s not yet overbought, so there’s room for the move to extend before momentum becomes a headwind. A push through the 4,150 pivot would open a test of the 4,248 200-MA, and a clean break there would be the first real technical evidence that the daily downtrend is losing control; conversely, losing the 4,092–4,098 MA cluster would put the recent bounce back in question and expose the 4,000 level again. For anyone trading this short-term setup, a stop below the 4,092 MA support keeps risk tied directly to the level that currently validates the bullish thesis.