DAX
 23 Jun 2026
DAX: 4-hourly and daily chart technical view.
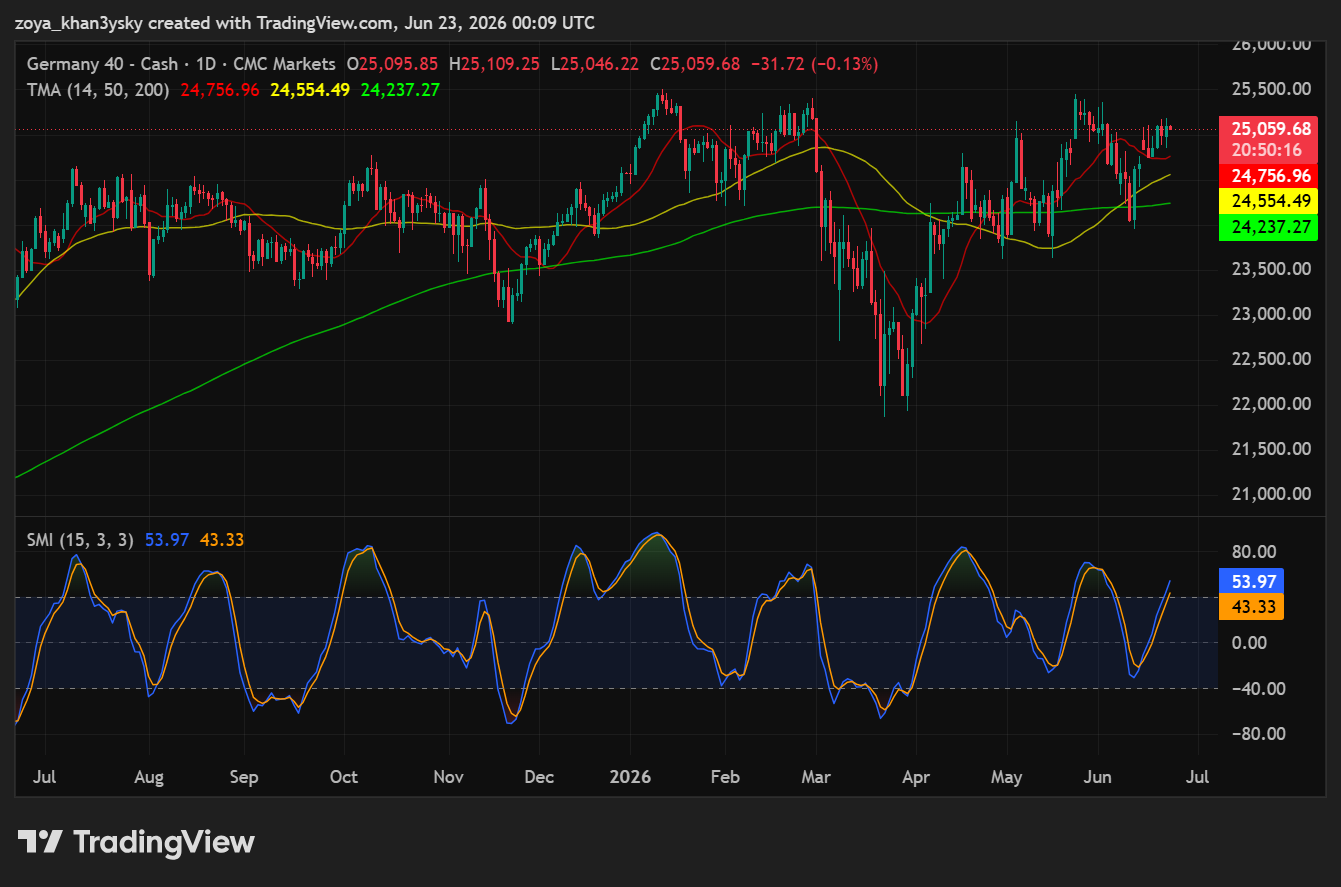
Daily Chart: Longer Term Bias: Bullish
| Resistance |
25,500 then 26,000 |
| Support |
24,757 then 24,237 |
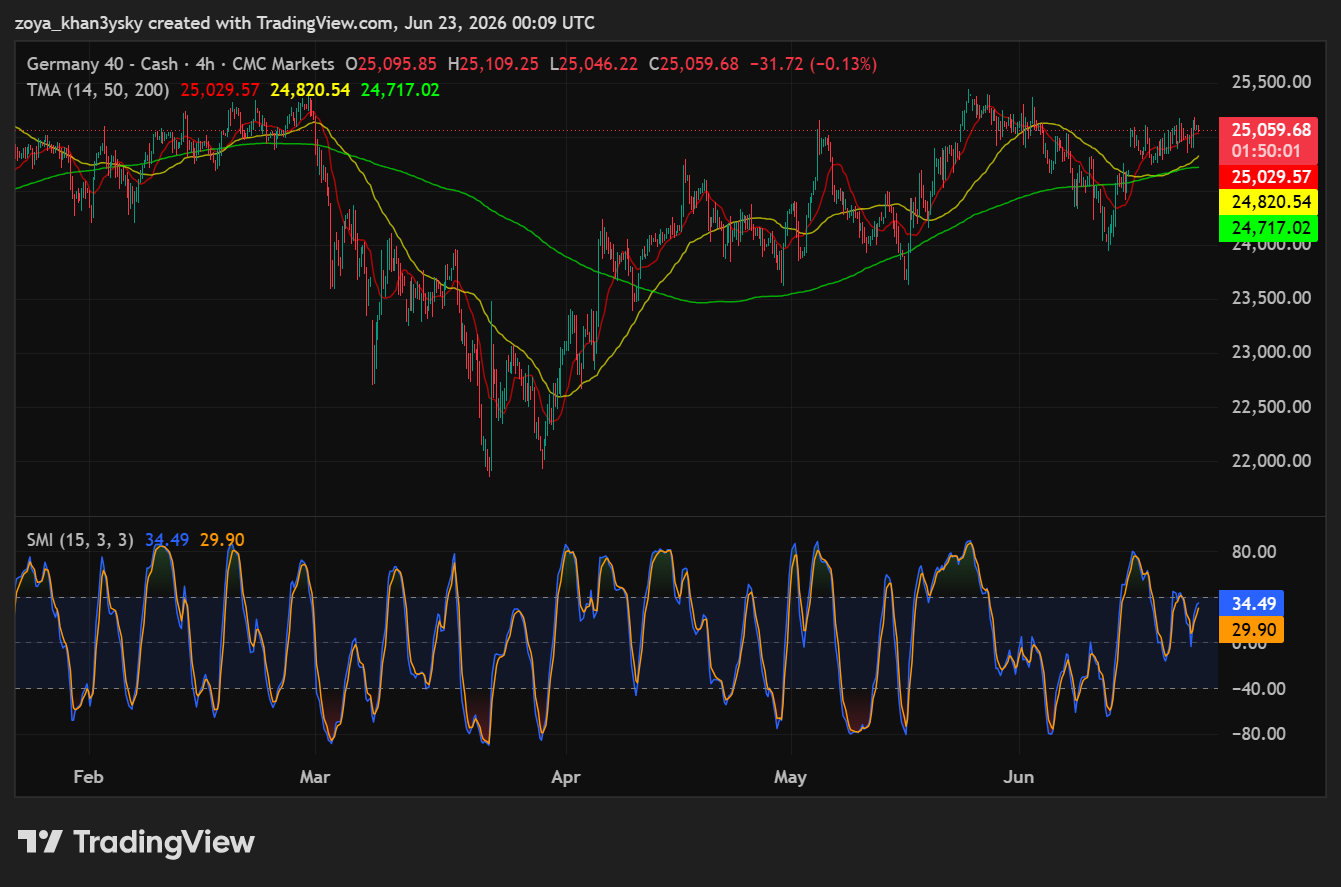
4-Hour Chart: Short-Term Outlook: Bullish
| Resistance |
25,300 then 25,500 |
| Support |
24,820 then 24,717 |
Daily Chart: Longer-Term Bias: Bullish
4-Hour Chart: Short-Term Outlook: Bullish
Tuesday 23rd June
The daily chart for the Germany 40 presents a constructively bullish longer-term bias, with price at 25,059.68 having staged a remarkable recovery from the April 2026 crash low near 22,000 and now trading above all three key moving averages — a bullish alignment that confirms the trend has meaningfully shifted in favour of the buyers. The 14-period TMA (red) at 24,756.96 is the most immediate dynamic support and has recently been reclaimed from below, a technically significant development as it signals that short-term momentum has reasserted itself to the upside after the prolonged April–May consolidation phase. The 50-period TMA (yellow) at 24,554.49 and the 200-period TMA (green) at 24,237.27 are both now positioned below current price and are beginning to slope upward, suggesting that medium and longer-term momentum is gradually rotating bullish — this “moving average convergence” from below, where price has successively reclaimed each average, is a classic sign of a maturing trend recovery. The price structure since the April lows traces a clear sequence of higher lows and higher highs, with the most recent push toward the 25,500 area representing a challenge of the prior January 2026 highs, which constitute the next meaningful horizontal resistance. The SMI at 53.97/43.33 is in positive territory with the main line (blue) above the signal line (orange), confirming active bullish momentum — critically, the SMI has been making higher highs in sync with price since the April trough, meaning there is positive confirmation rather than divergence, which validates the continuation of the uptrend rather than warning of exhaustion. However, the SMI is approaching the upper boundary of its range and will enter overbought territory above approximately 60–70, which warrants monitoring for any early signs of momentum fatigue as price challenges resistance. Traders with a bullish bias should target 25,500 as the immediate resistance, with a further objective at 26,000 on a sustained breakout, placing a stop loss below the 14-period TMA at 24,757 to protect against a reversal back into the prior consolidation range.
The 4-hour chart supports the bullish short-term outlook, with price at 25,059.68 trading above all three TMAs, which are tightly bunched together and beginning to align in a bullish stack — the 14-period TMA (red) at 25,029.57 sits just below current price as dynamic support, the 50-period TMA (yellow) at 24,820.54 provides secondary support, and the 200-period TMA (green) at 24,717.02 represents the deeper structural floor, all three converging in a zone between 24,717 and 25,030 that now constitutes a significant support cluster. The price action from the April 2026 lows near 21,900 has been a textbook recovery sequence on this timeframe, with the market systematically reclaiming each moving average from below before using them as springboards for further advances — the most recent successful retest of the 200-period TMA and 50-period TMA confluence zone in mid-June before the latest leg higher confirms that buyers are defending these levels with conviction. The immediate challenge for price is the 25,300 area, which corresponds to recent intraday highs and a minor horizontal resistance, beyond which the more significant 25,500 level aligns with the January 2026 daily chart highs and would represent a key breakout level. The SMI at 34.49/29.90 sits in mildly positive territory with the main line (blue) above the signal line (orange), indicating that momentum is constructive but not yet overextended — this mid-range SMI positioning is particularly favourable for bulls as it suggests there is meaningful room for momentum to expand before reaching overbought conditions, unlike a scenario where the SMI were already pressing against the upper extreme. The lack of any bearish divergence between price and the SMI — both are making higher highs in the recent recovery — confirms the integrity of the short-term uptrend. Traders should target 25,300 initially and 25,500 on a breakout, with a stop loss below the 50-period TMA at 24,820 to allow for normal intraday oscillation while protecting against a deeper retracement that would compromise the current bullish structure.
Daily Chart: Longer-Term Bias: Bullish
4-Hour Chart: Short-Term Outlook: Bullish
Monday 22nd June
The daily chart for the Germany 40 presents a bullish longer-term bias, underpinned by a powerful recovery from the April 2026 lows near 22,000 that has successfully reclaimed all three key moving averages — a technically significant development that confirms the structural trend has reasserted to the upside. Price is currently trading at 24,851, above the 14-day TMA (red) at 24,713, the 50-day TMA (yellow) at 24,527, and the 200-day TMA (green) at 24,229, with all three TMAs now in a bullish ascending alignment where price > 14-day > 50-day > 200-day — the ideal configuration confirming broad-based trend strength across all timeframes. The 200-day TMA at 24,229 is particularly significant as it represents the long-term mean of the market and its successful reclamation from below, following the sharp April breakdown, signals that institutional buyers have reasserted control and validates the recovery as more than a short-term bounce. The 14-day TMA at 24,713 and 50-day TMA at 24,527 now form a layered dynamic support structure that should contain any near-term pullbacks. The SMI at 34.62 (signal at 28.48) is in positive territory with the SMI line above its signal line, confirming active upward momentum — and critically, the indicator has recovered strongly from the deeply oversold readings near -40 seen during the April selloff without reaching overbought extremes, meaning there is meaningful momentum headroom remaining before the rally becomes overextended. There is no bearish divergence evident at this stage, with price and momentum both making higher structures in alignment, which reinforces the bullish bias. Immediate resistance is at the psychological 25,000 level, which aligns with the prior February–March consolidation highs, followed by the all-time high zone near 25,500. Bullish traders should target 25,000 initially, then 25,500, with a stop loss placed below the 200-day TMA at 24,229 to protect against a structural trend failure.
The 4-hour chart for the Germany 40 presents a neutral short-term outlook as price action consolidates in a tightly compressed range with all three TMAs converging around the current price level, creating a technical standoff between bulls and bears that requires a decisive directional break for clarity. Price is trading at 24,851, sandwiched between the 14-period TMA (red) at 24,971, the 50-period TMA (yellow) at 24,738, and the 200-period TMA (green) at 24,707 — with the three averages compressed within a narrow 264-point band, a configuration that reflects diminishing short-term directional momentum and typically precedes a volatility expansion in either direction. The fact that price is currently below the 14-period TMA but above the 50 and 200-period TMAs illustrates the indecision, as the very short-term momentum has dipped while the broader short-term structure remains intact. The SMI at 1.76 (signal at 17.35) is in neutral mid-range territory but has recently crossed below its signal line — a bearish momentum crossover that indicates short-term selling pressure is outpacing buying interest in the immediate term, and is consistent with the current pullback from the recent 25,200–25,300 swing highs. This bearish SMI crossover in neutral territory (not overbought) is particularly noteworthy as it suggests the pullback has room to extend modestly before oversold conditions develop. Immediate resistance is defined by the 14-period TMA at 24,971, which coincides with the recent swing high area and represents the level bulls must reclaim to reassert short-term control, with a break above targeting 25,200. Support is layered at the converging 50 and 200-period TMAs between 24,707–24,738, where a cluster of dynamic support is expected to attract buyers aligned with the broader daily bullish trend; a break below 24,707 would open a move toward 24,400. Traders should await a decisive break of either the 24,971 resistance or 24,707 support before initiating directional positions, using the respective broken level as a stop loss reference.
Friday 19th June
The daily chart for the Germany 40 presents a bullish longer-term bias as price at 25,057.55 is trading above all three key moving averages — the 14-day TMA at 24,736.39 (red), the 50-day TMA at 24,507.52 (yellow), and the 200-day TMA at 24,224.24 (green) — with all three averages now in a bullish alignment and curling upward, which is a technically significant development given that the index spent much of March and April trading violently below these levels following the sharp correction from the February highs near 25,500. The recovery from the April low near 21,900 back above all three moving averages represents a complete structural reclamation of the prior trend architecture, and the current positioning of price above the 14-day TMA — which is itself above the 50-day and 200-day TMAs — confirms that short, medium, and long-term momentum are now aligned to the upside. The 14-day TMA at 24,736 represents the first dynamic support level, with the 200-day TMA at 24,224 acting as the critical long-term floor that must hold on any pullback to preserve the bullish structure. The SMI at 35.66 with its signal at 23.45 is particularly informative — the SMI line is well above its signal line, indicating positive momentum breadth, and the reading is in the upper neutral-to-mildly-bullish zone approaching but not yet overbought territory above 40, which means there is still room for the upside to continue before momentum exhaustion becomes a concern. Critically, the recovery of both price and the SMI from the deeply oversold April lows — where the SMI fell toward -40 — represents a confirmed bullish recovery cycle where momentum and price have risen together, validating the directional bias rather than warning against it. The immediate upside target is the prior swing high resistance zone near 25,500, with a secondary target at the 26,000 psychological level if the breakout is sustained. Bullish traders should manage risk with a stop loss on a daily close below 24,736, as a breach of the 14-day TMA would indicate a loss of short-term bullish momentum and potential retest of deeper support.
The 4-hour chart for the Germany 40 reveals a neutral short-term outlook as price at 25,057.55, while above all three moving averages, is showing signs of short-term momentum deceleration after an extended rally from the April lows. Price is trading above the tightly clustered 14-period TMA at 24,921.93 (red), 50-period TMA at 24,696.20 (yellow), and 200-period TMA at 24,681.63 (green) — a configuration where the 50-period and 200-period TMAs are converging closely together near the 24,681–24,696 zone, indicating a key confluent support band that underpins the short-term bullish structure. The proximity of the 50-period and 200-period TMAs to each other is technically significant as it means that a breakdown through this zone would simultaneously breach both major moving averages, representing a meaningful structural deterioration. The SMI at 58.09 with its signal at 42.35 is elevated in overbought territory, with the SMI line significantly above its signal line — this divergence between the two SMI components warns that the current upside momentum may be stretched and a mean-reversion pullback or consolidation phase is increasingly probable in the near term. The absence of a fresh price-versus-SMI bearish divergence pattern — where price would make a higher high while the SMI posts a lower high — means the overbought condition alone is not a confirmed reversal signal, but the elevated SMI reading does argue against initiating aggressive new long positions at current levels without waiting for a retest of support. The 14-period TMA at 24,921 represents the first meaningful pullback target and a natural area to assess for bullish re-entry, with the confluent 50/200-period TMA support at 24,681–24,696 serving as the broader risk zone. Resistance above the current price lies at the recent swing high near 25,500, with a further extension toward 25,700 if momentum resumes. Traders holding long positions from lower levels should consider tightening stops to just below 24,921, while fresh entries are better suited to a pullback into the 24,921–24,696 support zone where risk-reward is more favourable.
We are glad you liked it
For your convenience, this will appear under your Saved articles in the top menu.